Document Type : Original Research Article
Authors
Department of Chemistry, University of Wah, Quaid Avenue, Wah Cantt., (47010), Punjab, Pakistan
Abstract
Cadmium is considered one of the most dangerous and toxic metals, human carcinogenic and teratogen impacting lungs, liver, and kidney. Its allowed amount in drinking water is 5 ppb, according to the US Environmental Protection Agency (USAEPA). In the present study, cadmium was removed from wastewater using Ni-Mn nanoparticles loaded on carbon as adsorbents. The effect of the adsorption parameters, including contact time, temperature, initial metal ion concentration, adsorbent dosage, pH, and the effect of shaking speed, has been evaluated. The results indicated that maximum percentage removal of cadmium was observed at pH 6, at 25 ppm initial metal ion concentration, i.e., cadmium, at a temperature of 308 K, and optimum shaking speed was 150 rpm. At the same time, the adsorbent dosage was 0.1 g/100 mL. The contact time for the establishment of equilibrium was 40 minutes. The adsorption isotherm model, such as Freundlich and Langmuir, was applied to the experimental data, and it has been observed that equilibrium data fitted well with the Langmuir adsorption isotherm. In contrast, data did not show agreement with the Freundlich adsorption isotherm. The different kinetics models were studied, such as pseudo 1st order and pseudo 2nd order. It was determined that experimental data show significant agreement with the pseudo 2nd order kinetics. Thermodynamics studies of adsorption were performed, and the parameters such as Gibbs free-energy change (∆G), change in the enthalpy of solution (∆H), and change in disorders of the solution (∆S) were also calculated, which gives the idea of the exothermic and spontaneous nature of adsorption process. The SEM results revealed that the particles lie at 2 µm. The EDX analysis shows the composition of carbon, nickel, and manganese. The XRD analysis shows that the adsorbent is crystalline in nature and the crystal structure is monoclinic.
Graphical Abstract
)
Keywords
Introduction
Water pollution is considered mainly due to contamination of external material like microbes, chemicals, and industrial waste. Contamination of several organic compounds, toxic heavy metals, and oil spillage also causes Water pollution, which has become the most critical and utmost affecting challenge worldwide [1]. The existence of certain biological and chemical ingredients and some of the natural processes cause water pollution. Water pollution leads to the most hazardous result, such as intense damage to the ecosystem [2].
Wastewater containing heavy metal ions produces by different industries such as pigments, cosmetics, varnish, paints, leather processing industries, mining activities, fertilizers, and metal electroplating. Wastewater produced from industries mentioned above has a lot of toxic metal ions. In reality, a specific industry produces a specific metal ion; for example, chromium is mainly produced by waste generated by leather processing, and the electroplating industry mainly generates Cd and Ni. Mercury (Hg) reaches into the atmosphere from burning coal [3].
Cadmium is a silvery white, compressible, ductile divalent metal. It has atomic number 48, belongs to a group in the periodic table, and lies in period 5. Its discovery was made by German scientist F.Strohmeyer in 1817 as a component of zinc ore. Cadmium has electronic configuration of [Kr] 4d10 5s2.Cadmium is present at 0.15 ppm inside the earth's crust, and a well-known cadmium mineral is Greenockite (CdS) [4].
It has been obtained in the form of by-products from sulfide deposits, majorly those having lead, zinc, and copper. Its concentration rises according to age inside the human body up to 30 mg till 40-50 ages and onward from that it decreases little. Cadmium is dangerous to the environment as well as to human beings. It is found in water, the atmosphere, and food. Its exposure leads to severe health problems and may lead to death [5].
All the analytical grade chemicals, including NiCl4.6H2O, Cd(NO3)2.4H2O, NaOH, HCl, and MnCl4.4H2O, were purchased from Sigma Aldrich and Merck private limited.
Coprecipitation method for nanoparticles synthesis
Preparation of pure Nickel doped with Zinc oxide and manganese doped with zinc oxide and the combination of Nickel and Manganese nanoparticles co-doped zinc oxide was carried out by using analytical grade salt of zinc, nickel, and manganese as [Zn (CH3COO)2.2H2O], [Ni (CH3COO)2 .2H2O], [Mn (CH3COO)2 .2H2O] respectively and the sodium hydroxide was also used in the fresh state as it is hygroscopic. During the synthesis process, a calculated concentration of [Zn (CH3COO)2.2H2O] was put in demineralized water to make a homogeneous mixture. A solution of sodium hydroxide was prepared in deionized water and added to the solution of zinc acetate drop by drop. As a result, white color precipitates were collected at the bottom, and this solution of kept on stirring for 30 min at a temperature of 250C. After that, it was placed in an oven at 80 oC for 5 h. After that, washing these white precipitates was done by using water and C2H5OH many times so that the pH became neutral as the pH became basic due to the addition of sodium hydroxide. Now the precipitates obtained in the form of nanoparticles were kept at a temperature of 120 oC in the oven for drying for 1 hour. The dried precipitates were collected in powder form and annealed at a temperature of 400 oC in the open atmosphere for 120 min. Hence, zinc oxide nanoparticles were obtained, and further studies were performed.
The preparation of Zinc and Nickel oxides was carried out by the preparation of the equi molar solution of [Zn (CH3COO)2 .2H2O], [Ni (CH3COO)2.2H2O]. The sodium hydroxide solution was prepared separately and added to the solution dropwise. After a few minutes of constant stirring, the synthesis of precipitates was started, and the white color was mixed with the pale green color. The precipitates were washed with ethanol and water and then dried in an oven, and the powder was collected and annealed for 120 min in the open atmosphere. Similarly, the nickel doped zinc oxide was synthesized for the manganese nanoparticles. As a result, the pale brown and black color powder was obtained, which were likely the characteristics of nickel and manganese.
250 mL de-ionized water was taken in a round bottom flask, adding 0.1 moles of NiCl4.6H2O and MnCl4.4H2O. Shake well; put a magnetic stirrer into the round bottom flask and place this flask onto the stirring plate with a stirring rate of 250 rpm for one an hour so that both of these salts get dissolved. A homogeneous solution was prepared when no particles were left un-dissolved at the bottom. Add 2M NaOH dropwise to form precipitates. When the color of the solution turned black addition of NaOH was stopped. The magnetic stirrer was removed from the round bottom flask. Washing of the precipitate was done by putting the precipitate in the centrifuge tubes, and samples were run for 5 min at 3750 rpm speed of the centrifuge. After centrifugation, sonication was carried out. This process was repeated up to five times until the pH became neutral. Washed precipitates were dried in an Oven at 80 oC for 5 hours. The precipitate was dried entirely. 4 g of Activated charcoal was taken, add it into 120mL de-ionized water in a 250 mL beaker. After that, the dispersion was done in a sonicator for 40 min. After that beaker was placed on a stirring plate.Took a separate beaker and added 1 g of nanoparticles to 20 mL of deionized water. The nanoparticles solution was added into the charcoal solution dropwise with continuous mixing for better mixing. After that temperature of the hot plate was set to 100 oC. Upon evaporation, the material was dried and collected as an adsorbent.
The details of experimental design is given in supplementary information section 01
pH of the solution is considered to be the crucial parameter that affects the adsorption of metals ion on the surface of the adsorbent [6]. The solution pH greatly affects the adsorption process because the adsorption potency is related to the phylogeny of the metal ion and the active adsorbent site [7]. It has a significant influence on the charge on the surface of the adsorbent. Also, it influences the degree of ionization of metal ions in the solution, resulting in different adsorption capacities at different pH values [8]. The effect of the pH was investigated by keeping the other parameters constant with the following specifications initial metal ion concentration as 25 ppm, adsorbent dosage 0.1 g/100 mL, contact time of 40 min, and temperature of 35 oC. The surface reaction rate is appreciably affected by solution pH [9]. The experiment was performed from pH 0-10, and the equilibrium concentration of the cadmium was determined by atomic absorption spectrophotometer. The graph of the experimental data plotted pH vs. percent removal. Figure 1 explains that the removal percentage of cadmium increases by raising the pH. From the graph, it can be concluded that from pH 0 – 4 the removal percentage is 66 % for adsorbent and 55.09% for carbon and go to a maximum at pH 6 for both adsorbent and carbon as 84.15% and 78.36%, respectively. The adsorption of cadmium decreases by increasing the pH of the system; however, the experiment was conducted up to pH 10. At pH 10 the percentage removal decreases to 61.22% and 54.05% for adsorbent and carbon, respectively. The reason for the maximum removal of cadmium at pH 6 can be explained based on precipitation of cadmium ions as hydroxide Cd(OH)2 and Cd(OH)3, which are less soluble [10]. As the pH rises, insoluble cadmium hydroxide formation occurs and precipitates, which makes sorption study impossible. At pH less than 4, due to excess of H+ ion, competition for an active site exists between the H+ ions and the Cd+2 ion. As a result of this competition, the preferable adsorption of cadmium decreases due to excellent mobility and higher concentration of H+ ions [11].
 Figure 1. Effect of pH on percentage removal of Cd(II) on carbon & Ni-Mn@C NPs
For practical implications of decreasing water pollution, it is pertinent to find out the optimized adsorbent dosage [12]. The effect of dosage as a factor affecting the removal of cadmium from the solution was determined. The effect was studied by changing the dosage of the adsorbent from 0.05 – 0.15 g/100 mL by keeping the other conditions, such as the initial concentration of metal ion as 25 ppm over 40 min at 35 oC and pH of the solution kept 6 ± 0.2. A separate experiment was also conducted for the carbon under similar conditions. The result has been plotted between adsorbent dosage, carbon dosage, and cadmium percent removal, as shown in Figure 2. The percent removal of cadmium was as follows for the dosage of adsorbent 0.05 g/100 mL, 0.1 g/100 mL, and 0.15 g/100 mL 55.9 %, 82.3%, and 80.3%, respectively. The percent removal of cadmium by carbon also shows a similar trend. However, carbon removal efficiency is low compared to the adsorbent. The graph shows the percent removal for carbon as follows 37.62%, 60% and 58% for carbon dosage 0.05 g/100 mL, 0.1 g/100 mL and 0.15 g/100 mL, respectively. The % removal of metal ions varies linearly with adsorbent dosage [13]. The increase in the percentage removal of cadmium ions from the solution from 0.05 g/100 mL to 0.1 g/100 mL was explained on the basis that when the dosage of the adsorbent increased, the approach of the adsorbent to the active sites became easy and hence more and more cadmium got attached on active site [14]. This can also be explained in different words.
For constant initial concentration of metal ions, increasing adsorbent dosage provides a greater surface area for the metal ion to get attached to the surface of the adsorbent [15]. At a low adsorbent dosage, the surface for metal ions to get attached decreases, which minimizes the adsorption [16]. Experimental data also illustrate that the removal is fast, up to 0.1 g/100 mL, and starts decreasing. It can be seen from the graph that at the adsorbent dosage of 0.1 g/100 mL, maximum removal was observed. After that, percentage removal decreases sharply at the adsorbent dosage of 0.15 g/100 mL. This occurs due to accumulating active sites at higher adsorbent dosages [17]. Therefore the adsorbent dosage of 0.1 g/100 mL was taken as the optimum dosage.
 Figure 2. Effect of Adsorbent (Ni-Mn@C / carbon) dosage on percentage removal of Cd(II)
The effect of temperature on the removal percentage of cadmium was explored. It has been observed that by increasing the temperature, the removal percentage increases [18]. The experiment was conducted at four different temperatures, i.e., 298 K, 303 K, 308 K, and 313 K, by keeping the other parameters as pH at 6, adsorbent dosage 0.1 g /100 mL, shaking speed 150 rpm, and the initial metal ion concentration as 25 ppm (Figure 3). The graph illustrates that by rising temperature, the rate of adsorption increases, and the maximum removal was obtained at 308 K. After that, no change occurred.
The reason for this removal can be explained in terms of the availability of active sites increases by rising the temperature [19]. Another significant result of this behavior is that Cd(II) adsorption on Ni-Mn nanoparticles is endothermic, as a rise in temperature favors adsorption [20]. As the adsorption capacity increases linearly with temperature, it confirms that chemisorption has taken place between the metal ion and the adsorbent surface [21]. On the other hand, in the case of the exothermic nature of adsorption, a weak bond will be formed between the metal ion and the adsorbent surface, which shows physisorption [22, 23].
The feasibility and spontaneity of adsorption were checked by calculating thermodynamics entities such as Change in Gibbs free energy (ΔG∘), change in entropy (ΔS∘), and change in enthalpy (ΔH∘). ΔG∘ was determined by using the following Δ𝐺∘ = −𝑅𝑇ln𝐾
Where R represents the universal gas constant having a value of 8.314 J/mol⋅K. T represents the absolute temperature, K represents the diffusion coefficient expressed in terms of 𝑞𝑒/𝐶𝑒, where qe represents the amount of cadmium adsorbed on the surface of adsorbent at equilibrium and Ce represents the available concentration of cadmium at equilibrium in solution
ln𝐾 = −Δ𝐺∘/𝑅𝑇
lnK = −Δ𝐻∘/𝑅𝑇 + Δ𝑆∘/𝑅
The above equation is known as the VanHoff equation; ΔH∘ and ΔS∘ were calculated from the slope, and the intercept of the graph plotted Lnk vs. 1/T (K-1) is presented in Table 1.
 Figure 3. Effect of temperature on percentage removal of Cd(II) on Ni-Mn@C and carbon
Table 1: Thermodynamic parameters for the removal of Cd(II) by Ni-Mn@C

The effect of initial concentration & effect of shaking speed are given in supplimentry information section 2 and 3 respectively.
Effect of contact time
The influence of contact time on the percentage removal of cadmium by using Ni-Mn nanoparticles by keeping the initial concentration of cadmium ion at 25 ppm and the other parameters such as temperature at 35oC, adsorbent dosage 0.1 g/100 mL, and pH of the solution as 6 was determined. The experiment was also conducted for activated carbon under similar conditions (Figure 4). The percentage removal was investigated by adsorbent and carbon. The sample was collected after regular intervals of 0, 1, 5, 10, 15, 20, 30, 40, 60, 90, and 120 min. There has been observed a rapid increase in the removal percentage of the cadmium from the solution up to 40 min; however, after 40 min, no change was observed in the cadmium removal of the cadmium. The fast removal in the start was actually due to the active sites' availability and greater, more excellent surface area [24]; at 40 min, the complete removal occurs. After 40 min infects, equilibrium was established. The removal percentage of cadmium for adsorbent of 0, 1, 5, 10, 15, 20, 30, 40, 60, 90, and 120 min were 50.8%, 54.4%, 65%, 70.4%,72.8%, 74.8%, 78.4%, 80.4%, 80.4%, 80.4%, and 80.4%, respectively. The percentage removal by the carbon for 0, 1, 5, 10, 15, 20, 30, 40, 60 and 90 minutes was as 36.4%, 43.6%, 53.8%, 56.4%, 59.2%, 61.6%, 64%, 67.2%, 67.2%, 67.2%, 67.2%
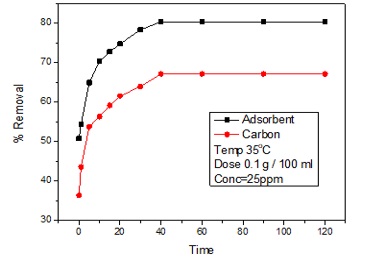 Figure 4. Equilibrium time study for Cd (II) removal on Ni-Mn@C and carbon
SEM
In the last 80 years, electron microscopy has become an innovative technique for scientists and engineers in nanosciences. It is also beneficial in the characterization of exclusive features. The electron microscope is vital to view a particle of the size of a submicron and can also imagine the particle in only one position. As a result, a total of new nanotechnologies have been developed, and considerable progress has been made in nanoscale engineering and the area of a microsized object. The SEM results shown in Figure 5-A reveal that particle sizes are irregular in shape. In addition, there is no uniformity in the structure of the crystals. It is also observed that particle size ranges from nano to micro size, and the surface is rough.

Figure 5 (A): SEM of Ni-Mn NPS Loaded on carbon (B): XRD analysis of Ni-Mn NPS loaded on carbon (C): EDX of Ni-Mn NPS loaded on carbon
XRD
The X-ray diffraction analysis was performed to determine the degree of crystallinity of the Ni-Mn nanoparticles loaded on the carbon. Figure 5-B of the XRD data shows that the material is crystalline due to very sharp peaks. The lattice constant a, b, and c has been determined for the Ni-Mn nanoparticles as a= 11.1370Å, b= 8.2790 Å, and c= 5.5381 Å. The diffraction angle between the length is β=100.423 showing that the crystal system is monoclinic.
EDX analysis includes a variety of studies because of its great degree of sophisticatedness in determining the presence of various elements.
The EDX analysis of Ni-Mn nanoparticles loaded on the carbon used as adsorbent was performed to check the elemental composition of nickel, manganese, and carbon. The spectrum of adsorbents is shown in Figure 5-C. The spectrum also shows the presence of calcium and magnesium.
The removal mechanism of heavy metals ion through adsorption on the surface of the porous adsorbents, requires a lot of steps, and every one of them has a more significant effect on the adsorption kinetics. These include external resistance to transport, intraparticle transport, bulk solution transport, and adsorption (in the case of physical adsorption, it occurs very fast). These transport steps take place in a sequence, and the slowest steps will determine the speed of removal, often called the rate-determining step. The speed at which adsorbate adsorb on the surface of the adsorbent is considered the most critical aspect of the adsorption system. The system's kinetics controls the time to which the adsorbent remains on the surface of the adsorbent and reactor dimensions.
The pseudo-second-order kinetics describe that adsorption occurring on the surface of the adsorbent is chemical. This adsorption process depends upon the nature of the active site present on the surface of the adsorbent. The -second second-order kinetic model was applied to the data obtained from the experiment, and it has been observed that this model best fits the experimental data (Figure 6). The pseudo-second-order parameters are given in Table 2. The linear equation of the pseudo-second-order kinetic model obtained after integration from the time interval ranging from zero to t for time and from zero to qt for qt can be written as
It has been observed that a straight line is observed when the time was plotted against t/qt, since the line is passing through the dots. Using the slope and the intercept of the graph, if t/qt versus time k2 and qe were calculated. The value of R2 was calculated, and it was found to be very close to one showing that pseudo 2nd order is suitable for the given experimental data.
 Figure 6. Pseudo second order kinetics for Ni-Mn@C
Table 2. Kinetic modeling data for the removal of cadmium by Ni-Mn NPS loaded on carbon

Adsorption isotherms help us to understand the relationship between adsorbent and adsorbate [25].
Langmuir adsorption isotherm
Langmuir adsorption isotherm simulates adsorption as a homogenous process in monolayer formation so that adsorption occurs at uniform and localized sites. Hence, there should be the possibility of lateral interaction between the adsorbed molecules [26]. The Langmuir model was implemented to the data obtained from the experiment (Figure 7A), and the value of the qm, KL, RL, and R2 was calculated.
Qm= 23.6127 mg/g, RL= 0.033 , KL= 0.530 and R2= 0.970
We can represent the Langmuir model in another way known as dimensionless constant RL, which is expressed as
Where C0 represents the initial metal ion concentration, the value of R is significant for us, and it tells us whether the applied model is favorable or not. The adsorption process is favorable if RL value is from 0 – 1 (0 < RL < 1). As our RL value is in between this range and the value of R2 is also close to 1, our data is completely fitted to the Langmuir adsorption isotherm. The Langmuir parameters are given in Table 3.

Figure 7. (A) Langmuir adsorption isotherm for Ni-Mn@C (B) Dubinin–Radushkevich (D–R) isotherm for Ni-Mn@C
Dubinin–Radushkevich (D–R) isotherm
The Dubinin–Radushkevich model is applied to the data given in Figure 7-B. The D-R equation is given below,
Where qe is the number of metal ions adsorbed per gram of adsorbent when equilibrium establishes, qmax is the maximum amount of adsorbate taken up by the adsorbent per unit mass of adsorbent, β (mol2 kJ−2) has a constant value and is relevant to the means adsorption energy also known as D-R equation constant, and ε (kJ mol−1) is known as Polanyi potential also known as adsorption potential. The fundamental requirement for Dubinin–Radushkevich model is the exact calculation of the Polanyi potential.
Hence the solutions are made in water. The adsorption potential can be expressed as
𝜀 = RT ln (Cs /Ce)
when various values of β are taken, the various isotherm curves are obtained so that the concentration when equilibrium establishes should be equal to solubility. The results will show the agreement with the modified Langmuir adsorption isotherm. In addition, the β is important in determining the mean free energy. The mean free energy for DR isotherm is given by [27].
A phenomenon can be differentiated with the knowledge of the mean free energy kind of adsorption.
The D-R model is an essential tool to make the difference between the physical and chemical nature of the adsorption process of the pollutant of the exterior of the adsorbent. The equation of the D-R model can be written as
qe is the number of metal ions adsorbed per gram of adsorbent when equilibrium establishes,
qmax is the maximum amount of adsorbate taken up by the adsorbent per unit mass of adsorbent. K is the constant which has related to the energy of the adsorption, and is the highest adsorption capacity
)
R is the universal gas constant, and t is the temperature in Kelvin. K has a constant value representing the mean free energy E adsorption of a single molecule of the pollutant when it comes to attaching to the surface of the adsorbent from a considerable distance from the solution. The value of the E can predict the nature of adsorption. The value of the E Less than 8 KJ/mole represents the physisorption, while the value of E between 8 and 16 represents the kind of adsorption ion exchange. The value of E can be determined from the following equation
The mean free energy of adsorption E can be defined as the free energy change when one mole of ion is transferred from infinity in solution to the adsorbent. A graph is plotted between Lnqe and 2 , and L Shaped graph was obtained. The value of K was calculated to be 1.68E-06 ( mol2/ kJ2), and the value of E was 544.9078, which indicates that the adsorption process is physisorption.
Table 3. Adsorption isotherms data for the removal of Cd(II) by Ni-Mn@C
Conclusion
The research project was designed to study the adsorption capacity of commonly available bimetallic and tri metallic nanoparticles to remove cadmium from wastewater. The screening trials showed that the Ni-Mn nanoparticles showed the best adsorption capacity for the removal of cadmium. Process parameters like adsorbent dose, contact time, pH, and initial cadmium ion concentration were optimized. The contact time data were subjected to pseudo-first and pseudo-second order and the mechanism of the adsorption process. In the initial cadmium concentration study, it was observed that the percentage removal of cadmium increased by increasing the concentration but became constant after a specific limit. The reason for this limitation is the saturation of active sites. Different equilibrium models like Langmuir and Freundlich were applied, and constants were also calculated. In a temperature study, it was observed that adsorption is an exothermic process because adsorption capacity decreases by increasing temperature. The comprehensive study found that bimetallic nanoparticles loaded on carbon could be used to treat wastewater containing cadmium.
Acknowledgment
This work is financially supported by the Chemistry Department, University of Wah.
Disclosure statement
The authors reported no potential conflict of interest.
ORCID
Fawad Ahmad : 0000-0003-2404-5572
Qurat ul Ain : 0000-0002-3044-5807
Muhammad Asadullah : 0000-0002-0735-9476
)