Document Type : Original Research Article
Authors
1 Department of Chemistry, Kogi State College of Education, Ankpa, Kogi State, Nigeria
2 Department of Chemistry, Ahmadu Bello University, Zaria, Kaduna State, Nigeria
Abstract
Worldwide interest in biofuels, such as biodiesel and biogas as alternatives to fossil fuels, is growing. The transesterification method is usually applied in the production processes of biodiesel because of its numerous advantages. The viscosity of the oil sample was decreased by utilizing this technique. The production procedure of methyl ester is determined by the amount of free fatty acids (FFA) in the sample. The titration technique was employed to evaluate this for the crude cottonseed oil (CCSO) and used cottonseed oil (UCSO), with the following results: 0.56 % and 1.26 %. Heterogeneous alkali (calcined commercial CaO) catalyzed transesterification was used to convert UCSO into used cottonseed oil methyl ester (UCSOME). It involves the reaction of methanol with UCSO in the presence of the catalysts. Some of the reaction parameters that control the transesterification process were; the methanol-oil ratio, reaction temperature, reaction time, and catalyst concentration. The aforementioned parameters were optimized through the response surface approach; Box-Behnken Design (BBD). The response surface yield has been plotted graphically as part of the various parameters that improve biodiesel yield. An optimized UCSOME yield of 93.60 % was obtained at a 1:10 molar ratio, 2.5 wt.% catalyst concentration, 80-min reaction time, and 60 °C reaction temperature. 94.50 % was the experimental yield obtained based on these parameters, which shows that the response surface methodology is a successful technique for optimizing the yield. The purity of the methyl ester was determined using GC-MS and FTIR.
Graphical Abstract
)
Keywords
Introduction
Due to its advantages over traditional diesel fuel, such as being biodegradable, renewable, non-toxic, producing less gaseous and particle pollutants, and having a higher cetane number, biodiesel has gained much interest a viable substitute for diesel fuel in recent years. Furthermore, it meets the constantly expanding global energy needs, which are currently satisfied mainly by petroleum-based fuel supplies, which will soon get exhausted if the existing energy consumption pattern is maintained. Through transesterification, vegetable or animal fats are converted into biodiesel [1].
Transesterification, also known as alcoholysis, converts triglyceride molecules into alkyl esters for biodiesel fuels with glycerol as a byproduct. Alcohols are utilized along with catalysts such as a base, acid, or enzyme, depending on the amount of free fatty acids in the feedstock. One of the most frequently used alcohols in transesterification reactions is amyl alcohol, methanol, ethanol, butanol, butanol, and propyl alcohol. However, the most common ones are methanol and ethanol, with the former being more popular due to their low price. For transesterification, vegetable oils like soybean and rapeseed oil are frequently used as feedstocks. Several years ago, there was an ongoing study into the production of biodiesel from cottonseed oil [2-4], which, through enzyme-catalyzed transesterification of refined cottonseed oil with short-chain primary and secondary alcohols, converted between 72 and 94 % biodiesel. Similar research was carried out on cottonseed oil via transesterification using solid acid catalysts [5]. The results showed a recovery of over 90 % methyl ester during an 8-hour duration [6].
In comparison, cottonseed oil was transesterified utilizing a microwave irradiation oven as a reactor to produce 89.5 to 92.7 % more biodiesel [7]. The disadvantage of homogeneous alkaline catalysts is that they need a lot of energy, produce too much water, and are challenging to separate [8,9]. However, heterogeneous catalysts may be reused, produce very little water, and use little energy as an added advantage [10]. CaO is one of the most popular catalysts used in biodiesel production because of its low cost and high activity. CaO is prevalent in considerable quantities in nature [11]. In previous works of literature, waste eggshells were calcined to produce CaO, which exhibits superior catalytic activity, an alkaline characteristic, and a unique porous structure [12]. Regardless of the kinds of catalysts or procedures employed, all those studies aimed to produce a high biodiesel yield through optimal reaction conditions based on optimized parameters for the alcohol/oil molar ratio, catalyst concentration, reaction temperature, and time.
Moreover, the typical one-factor-at-a-time approach to process optimization seems impractical because it takes a long time and is practically impossible to reach the truly optimal condition. Response surface methodology (RSM) is an effective tool for processing optimization. In response surface methodology (RSM), an experimental strategy first introduced by Box and Wilson to target ideal states for a multivariable system [13]. In this study, transesterification of UCSO with methanol in the presence of calcined commercial CaO was optimized using Box Behnken Design (BBD), a subset of RSM, to produce methyl ester with the optimum yield.
Methodology, Materials and Chemicals
Collection of Reagents
In the experiment, commercial CaO from Merck Life Science Pvt. Ltd., 99.5 % pure methanol, and 99.9 % pure isopropyl alcohol from Thermo Fisher Scientific Private Ltd., respectively, were utilized.
Preconditioning of UCSO
Inorganic specks of dirt were filtered out of 10 L of UCSO samples purchased from a local eatery in Funtua, Katsina state, Nigeria. The color indication titration method was used to determine the FFA contents of the UCSO samples following ASTM D974 specifications. The oil sample was heated to 105 °C and kept constant for a short period to completely evaporate the moisture content.
Methodology
The transesterification process was carried out in a 500 cm3 three-necked round-bottomed flask equipped with a reflux condenser. A mechanical stirrer running at an appropriate rotation rate per minute (rpm) was used to stir the mixture. 50 g of UCSO reactants were employed in each experiment, together with commercial alkali-calcined CaO acting as a heterogeneous catalyst. The Gallenhamp magnetic stirrer hot plate was used to heat the reaction flask. After the reaction period, the mixture was poured into a 75 cm3 sample tube for centrifugation (for 15 minutes duration). The ester and trace glycerol layers were then separated by decanting the top layer into a separating funnel. Glycerol, extra methanol, and other compounds were decanted from the lower layer. The top layer of UCSOME was decanted and washed with phosphoric acid (0.1 wt. %) and distilled water to remove traces of methanol, glycerol, and the catalyst. The UCSOME was washed repeatedly until the solution of the final product had a pH of 7. Finally, the product was heated to 100 °C to eliminate the moisture content [14,15].
The yield of UCSOME was calculated by Eq. (1).
 (1)
(1)
Catalyst Preparation
Individual batches of commercial CaO were calcined at 800 °C in a muffle furnace with static air at a heating rate of 2.5 °C/min for 4 hrs. All calcined samples were stored in a closed desiccator to prevent reactions with CO2 and moist air before use [16].
Instrumentation
Gas chromatography was used to calculate the relative percentages of different Fatty acids Methyl Esters (FAME) in the UCSOME. A TR-Wax MS column (Make: Agilent) was attached to the gas chromatograph (Thermo Scientific, Model: Trace GC Ultra) with an electron impact detector (Varian, Model: Polaris Q) 30 m long, 0.25 mm ID, with a film thickness of 0.25 µm. Helium gas of 99.99 % purity with a flow rate of 1 mL/min was used as the carrier gas. The split ratio is kept constant at 1:20. After filtering the sample through a syringe filter (Make: Millex; Model: GV; Pore Size: 0.22 lm), 1µl of the sample was injected. The oven temperature was kept at 70 °C with a hold-up time of 2 min. Then the oven temperature was increased to 100 °C with a rate of 10 °C min-1 and was kept there for 2 min. Thereafter, the oven temperature was changed to 250 °C with the same rate of heating kept for 5 min. The final temperature of the oven was maintained at 250 °C. The peaks were identified by comparing their retention times and mass spectra with the NIST14 Library. In the same vein, a Perkin Elmer 1000 spectrometer was used to record the FTIR spectra of the samples (Perkin Elmer, Waltham, MA, USA) utilizing a spectral range of 4000-400 cm-1 with a resolution of 4 cm-1 and the KBr disk technique in transmittance mode to ascertain whether a functional group was present in the calcined commercial CaO. These samples' general properties, including acid number, viscosity, density, and flash point, were investigated.
In contrast, a scanning electron microscope (SEM) (ZEISS EVO LS10 operating at 20 kV) was utilized to analyze the surface morphology of the synthesized catalyst. EDS (JEOLJSM-600F)) analysis was utilized to determine the elements present in the synthesized catalyst. Finally, X-ray diffraction (XRD) analysis was carried out to verify the composition of the catalyst (XRD Rigacu MiniFlex 300) [16].
Experimental Design
This research aims to maximize the percentage yield of UCSOME biodiesel in response to the transesterification reaction of UCSO samples using a four-level Box-Behnken design (BBD) in response surface methodology (RSM). A: Molar ratio, B: Reaction temperature, C: Catalyst concentration, and D: Reaction time is the independent variables used for the investigation. Each factor was selected based on the variables that gave the optimum biodiesel yield from the literature and were fixed at three different levels, corresponding to low, medium, and high values: 1, 0, and +1. Tables 2 and 3 reveal the configuration of the factorial design. Eq. (2) represented the quadratic response model when all the linear terms, square terms, and linear by-linear interaction items were considered.
![]() (2)
(2)
Statistical Analysis
Software for statistical analysis Design expert version 11.0.0 Stat ease, Minneapolis, USA, was used to establish the importance of each variable, interaction, and quadratic term in the optimization process.
Results and Discussion
Effect of Operating Parameters on the Yield of UCSOME
A significant interaction effect between each of the two independent components, as shown in Table 4 was observed. The interaction effect of the molar ratio (A), reaction temperature (B), and catalyst concentration (C) was significant (p<0.0001). The other independent components of response time (D) at 80 minutes were held constant within the experimental range. In Fig. 1, the 3D surface for AB interactions is shown. Even while the divergence was considerable at 2.5 wt. % catalyst concentration, it was not at other catalyst concentrations. This difference in the molar ratio indicates an enhanced biodiesel yield.
The biodiesel yield increases to its highest point (93.43 %), which starts to decrease. Furthermore, as the molar ratio and reaction temperature increase, the UCSOME yield marginally increases. In general, a high molar ratio ensures the success of the reaction by increasing the rate of UCSOME production. But too much methanol increases glycerol solubility and prevents it from being separated from the methyl ester [17]. Figure 2 illustrates the comparative effect of molar ratio and reaction time on biodiesel yield when reaction temperature (55°C) and catalyst concentration (2.5 wt. %) were held constant. A UCSOME yield of 93.43 % was the optimum yield. When the reaction temperature was maintained constant, the molar ratio did not exhibit any appreciable fluctuation. The biodiesel yield increases to 93.43 % before decreasing [18]. Due to the increased dispersion of the alcohol into the UCSO, the rate of fatty acid esters increases with reaction time [19]. The 3D response surface plot of the predicted yield against reaction temperature and catalyst concentration is shown in Fig. 3. The graph shows that as reaction temperature and catalyst concentration increase, more UCSO is converted to UCSOME. However, the yield can be reduced with greater catalyst concentrations since the biodiesel yield is negatively affected by the catalyst concentration, resulting from soap formation during transesterification. The synthesis of UCSOME depends critically on the reaction temperature and catalyst concentration. The yield is increased to the greatest extent possible by the fluctuation in reaction temperature at the lower level of the catalyst. This is explained by the fact that an increase in catalyst concentration and reaction temperature induces the saponification reaction.

Figure 1. RSM plot of reaction temperature vs methanol/oil ratio at catalyst concentration 2.5 wt% and 80 min reaction time

Figure 2. RSM plot of methanol/oil ratio vs reaction time at reaction temperature 55 °C and 2.5 wt.% catalyst concentration

Figure 3. RSM plot of reaction temperature vs catalyst concentration at 10.4 wt.% methanol/oil ratio and 80 min reaction time

Figure 4. RSM plot of catalyst concentration vs reaction time at methanol/oil ratio 10.4 and 55 °C reaction temperature
 Figure 5. The UCSOME conversion predicted from model vs measured response
FFA Analysis of UCSOME
The fatty acid composition in the gas chromatogram includes; Palmitic acid, linoleic acid, 11-Octadecenoic acid, Linoelaidic acid, stearic acid, and Lauric acid primary fatty acids. With the following FFA compositions; Lauric acid at 1.78 %, stearic acid at 2.42 %, Linoelaidic acid at 7.69 %, 11-Octadecenoic acid at 16.04 %, linoleic acid at 25.65 %, and palmitic acid at 33.57 %, the profile shows a high percentage of saturated and unsaturated fatty acids. Almost all the free fatty acids were in the form of their methyl ester since the UCSO had been methylated before the GC-MS analysis. The methyl derivatives contain molecular ions that are 14 mass units larger than the parent compounds, yet they fragment in the same ways [20]. Palmitic acid continues to dominate with a relative percentage of 33.57 %, followed by linoleic acid at 25.65 % and 11-Octadecenoic acid at 16.04 %. However, polyunsaturated fatty acid methyl esters are susceptible to auto-oxidation, and palmitic and stearic acid saturation results from UCSO's relative oxidative and thermal stability.
In comparison, UCSO has more excellent stability compared to other polyunsaturated oils like mustard (94.27 %) and sunflower (88.39 %) [21]. This result is comparable to other reports described in the literature [22]. Similar to this, the fatty acid composition of UCSOME shows that the primary fatty acids detected include palmitic acid, linoleic acid, lauric acid, myristic acid, stearic acid, and arachidic acid. With palmitic acid at 29.64 %, linoleic acid at 33.43 %, lauric acid 8.10 %, myristic acid 6.67 %, stearic acid at 5.60 %, and arachidic acid 1.17 % FFA compositions, the profile reveals a high concentration of saturated fatty acids. Linoleic acid exhibits the primary peak for the unsaturated fatty acid, with the UCSOME showing a higher percentage of saturated than unsaturated fatty acids (Fig. 6). The fatty acid content resembles that described by [23]. Similarly, the large proportion of polyunsaturated fatty acids in UCSOME fuel, as in the oil, increases the likelihood that it will experience auto-oxidation and rancidity, damaging its storage property. The UCSOME fatty acid, which makes up 92.00 %, strongly indicates that it can replace fossil fuel [24-26]. These findings closely align with earlier reports on the Fatty Acid profile of CSO [27].
FTIR Analysis
The UCSOME produced from UCSO was sent for FTIR analysis after the transesterification process. The results are displayed in Figure 7 and Table 1. Alcohol, alkanes, alkynes, alkenes, and other functional groups present in the sample were identified. UCSOME exhibit high absorption at 2922 cm-1 in its IR spectra which was indicated by the aliphatic CH2 group symmetric stretching vibration caused by the high percentage of the linoleic acid group (33.43 %). Similar results were produced with yellow oleander seed oil [28]. They exhibit absorbance at the following other distances: 1741 cm-1, 1458 cm-1, 1435 cm-1, 1194 cm-1, 1167 cm-1, 1112 cm-1, and 588 cm-1. However, there is a distinction between the spectra of the UCSO. UCSOME possesses a distinctive FTIR absorption of carbonyl (C=0) stretching vibrations near 1740-1741 cm-1 and C-O bending vibrations in the 1196.4 cm-1 [28]. The signal at 1435 cm-1 (Fig. 7), is attributed to the vibrational deformation of the UCSOME group (CO)-O-CH3, which is present in the UCSOME spectrum but absent in the spectrum of the UCSO. The same result was obtained by [28,29]. The FTIR spectra of FAMEs also show the emergence of a signal at 964 cm-1 corresponding to CH2 in the RCOCO- group present in the UCSO but absent in the UCSOME, as well as a signal at 1167 cm-1 of the C-O group from the biodiesel.
Experimental Design
27 experimental runs were produced using the BBD (Table 3). Whereas the relevance of the regression model for the response was evaluated using the ANOVA test, the results are shown in Table 4. Model term values Prob>F<0.0500 show that specific circumstances make certain factors important. Significant model terms for response (% UCSOME yield) were A, B, C, AB, AD, BC, CD, A2, B2, C2, and D2. It was found that D-reaction time, AC, and BD do not affect the % UCSOME production efficiency as much as the other factors. The empirical relationships between the tested factor and response are presented in Eq. (3):
UCSOME YIELD = + 93.43 - 1.36 A + 1.72 B - 1.47 C - 0.5000 D + 1.55 AB - 0.6250 AC - 4.17 AD + 4.90 BC + 0.9050 BD + 3.18 CD - 24.40 A² - 7.15 B² - 7.82 C² - 3.50 (3)
As shown in Table 5, the R2 value obtained from an ANOVA analysis of the response components is 0.9953, which is very high and indicates a significant correlation between the actual and anticipated values (predicted vs. actual plot) (Fig. 5). The values were relatively close to the 45-degree line, which shows a good correlation between the predictions and the actual output of the model.
 Figure 6. GCMS spectra of UCSOME
 Figure 7. FTIR spectra of UCSOME
Table 1. Interpretation of FTIR peaks (cm-1) in Used Cotton Seed Oil Methyl Ester (UCSOME)

Table 2. Range of Process Variables for Box Behnken Design

Table 3. Experimental BBD Matrix


Model Fitting Statistics
The initial second-order quadratic model was built using BBD (shown in Equation 3), and the most crucial variables in converting UCSO to UCSOME were assessed by the ANOVA analysis, which is presented in Table 4. The central point of the BBD model is shown in runs 10, 23, and 24. The results of regression analysis show the significance of four quadratic terms (A2, B2, C2, and D2), three linear terms (A, B, and C), and four cross-product interaction terms (AB, AD, BC, and CD). These terms indicate that the variables significantly affect yield [30,31]. The F-values from the ANOVA analysis were 180.88 for a model term, 15.63, 24.75, and 18.06 for mole ratio (A), reaction temperature (B), and catalyst concentration (C), respectively; 6.75, 48.67, 67.28, and 28.29 for four cross-product interaction terms (AB, AD, BC, and CD), respectively; and 2223.97, 190.79, 228.39, and 45.76 for four quadratic terms. The high F-value of reaction temperature and catalyst concentration indicates that they were the experimental conditions that have the most significant effect on the conversion of UCSO to UCSOME. A p-value greater than 0.005 indicates that the lack of fit, which was used to test the model's applicability, is not significant, indicating that there is less error between experimental data and results predicted by BBD statistical analysis. The average observed value of 93.40 % and the predicted conversion value of 93.60 % were comparable. As a result, there was a good agreement between the experimentally obtained value and the predicted values. The regression model proved successful, as shown by the error values between the predicted and actual yield of less than 1 % UCSOME conversion.
Characterization of Catalyst
In figure 8, the FTIR spectra of the catalyst were displayed. The detected spectra bands at 3638.99 cm-1 and 3642.23 cm-1 were attributed to the presence of 0-H stretching vibrations of Ca(OH)2 because of the moisture absorption from an environment attached to the Ca atom on the surface of the pellets [32]. While the peak between 1406.21 cm-1 and 1430.33 cm-1 resulted from Ca-O stretching bending vibration. The band at 1396.84 cm-1, 873.99 cm-1, and 712.42 cm-1 in the spectra of the catalyst corresponds to the stretching vibration of CO32- group caused by the chemisorption of gaseous CO2 from the atmosphere on the catalyst surface [33]. More so, at 528 cm-1, the Ca-O stretching vibration mode of the bond was manifested, providing strong evidence for the formation of CaO. Similarly, the XRD results were matched with the JCPDS card number 37-1497, and calcined commercial CaO diffraction peaks at 2 of 18.11, 51.10, 59.51, 62.84 are ascribed to Ca(OH)2 [34]. In the XRD analysis, there is no trace of the CaCO3 phase. This indicates that all the CaCO3 phase was converted into pure CaO, with few mixed Ca(OH)2 phases; however, CaO is the dominant phase. During the calcination process, CaCO3 is usually calcined into CaO and Ca(OH)2 phases due to the release of CO2 from the commercial CaO structure after calcination [35]. The highly hygroscopic nature of CaO led to the formation of Ca(OH)2 [36]. Consequently, absorbing atmospheric moisture converts it to Ca(OH)2 [37]. Using the Debye-Scherer equation, the average crystallite size of the strongest (111) was calculated [38] and was found to be 111.30 nm given in equation (4) as;
d = Kλ/β cos θ (4)
Where; β = full-width at half-maximum (in radian) and θ = is the position of the maximum of the diffraction peak. K is defined as the so-called shape factor, which usually has a value of about 0.9; λ = the X-ray wavelength (1.5406 Å for Cu Kα).
Hence, the XRD pattern confirms the result, which shows that commercial calcined CaO has a face-centered cubic phase structure. These results were equivalent to those obtained by [39-41]. The results were also comparable to those obtained by [42,43]. Moreover, the catalyst exhibits a maximum particle size reduction and a greater surface area, two crucial characteristics of heterogeneous catalysts. The SEM micrograph of the catalyst shows regular particle morphologies with clusters of well-developed cubic crystals and a distinct reduction in particle sizes, indicating a larger surface area which is beneficial for the transesterification reaction [44] as shown in fig. 10. The EDX spectra and elemental composition were observed in Figure 9; After the calcination, it revealed the presence of calcium (Ca) and oxygen (O) elements in the calcined commercial CaO, with an average fractional weight of 92.82 % and 7.18 %, respectively. This confirms the existence of the CaO phase. Thus, the results of the EDX indicate the absent of impurities, which the XRD results validate.
Table 4. ANOVA for the quadratic model regression


Table 5. The R-Squared Results
Table 6. Verification of the Design Models

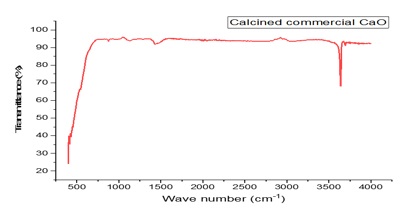 Figure 8. FTIR spectra of the commercial (Calcined commercial CaO)
 Figure 9. EDX of calcined commercial CaO Catalyst
Reusability of the Calcined Commercial CaO
Catalyst stability and reusability are critical characteristics in industrial applications. The reusability of the calcined commercial CaO catalyst was thus tested six times using a methanol-to-the oil ratio of 10.4:1, a reaction temperature of 55 °C, a reaction time of 80 minutes, and 2.5 wt. % catalysts (based on oil weight). The results are shown in Fig. 12. After each cycle, the solid catalyst was filtered out of the reaction mixture, cleaned of any adsorbed stains with methanol, and then recalcined at 600 °C for further use. The results revealed that a high UCSOME conversion of above 70 % was obtained for each of the six tested runs. With a conversion of more than 70 %, the catalyst can be employed up to six more times before the conversion starts to decline noticeably. The leaching of active species into the UCSOME phase was one potential cause of this activity loss. However, the catalytic activity will be reduced by the partial dissolution of the bulk CaO in a methanolic solution [45]. The catalyst was rendered inactive due to the loss of active sites because of pore blockage [46]. SEM micrograph shows that the catalyst surfaces were covered with intermediates or products like UCSOME, diglycerides, monoglycerides, and glycerol (Fig. 10)
 Figure 10. SEM Micrograph of calcined commercial CaO Catalyst
 Figure 11. XRD pattern of the Calcined Commercial CaO
 Figure 12. Effect of Reusability of Catalyst on FAME Yield
Conclusions
The current study investigates the effects of several process parameters on the yield of UCSOME, including the molar ratio, catalyst concentration, reaction temperature, and reaction time. The one-time UCSO was utilized to examine the effect of reaction parameters on biodiesel yield based on its FFA value. Alkaline transesterification is a reliable technique for producing biodiesel, as evidenced by the 1.26 % FFA value of UCSO. More so, the objective of the research was to use a mathematical equation generated by RSM to optimize the individual reaction components to increase the yield of UCSOME. The highest biodiesel yield of 94.60 % was obtained at a 10.40 molar ratio, 2.5 wt.% catalyst concentration, 80 minutes of reaction time, and 55 °C reaction temperature. The experimental trial was conducted using the optimized condition, and it was discovered that the experimental yield of 93.40 % and the predicted yield of 93.60 % had a strong correlation. The regression model proved successful, as seen by the error values between the predicted and actual results being less than 1 % UCSOME conversion. The fatty acid methyl esters of UCSO displayed distinctive carbonyl (C=O) stretching vibrations of 1741 cm-1 in their FTIR spectra. The detection of a signal at 1458 cm-1 for the (CO)-O-CH3 group (a methyl ester group) in the produced UCSOME served as evidence of the occurrence of transesterification, which was absent in fossil diesel. In addition, the GC-MS result indicated that UCSOME had 95 % saturated and unsaturated fatty esters, thus showing the potential for high fuel combustion temperatures.
Acknowledgment
The management of Ahmadu Bello University Zaria Multi-User Science Research Laboratory is acknowledged by the authors for providing the laboratory space necessary for this investigation.
Disclosure statement
The authors reported no potential conflict of interest.
ORCID
Jimoh Abdullateef : 0000-0002-3240-9682
)