Document Type : Original Research Article
Authors
Department of Physics, Faculty of Science, Shahid Chamran University of Ahvaz, Ahvaz, Iran
Abstract
In this study, single-phase bismuth ferrite (BiFeO3) was synthesized using hydrothermal method. The effect of KOH concentration and temperature during the reaction on morphology, particle size, and phase formation was investigated. Then, the structural properties of the samples were assessed using X-ray diffraction (XRD), field emission scanning electron microscopy (FE-SEM), transmission electron microscopy (TEM), Fourier transform-infrared spectroscopy (FT-IR), and vibrating sample magnetometer (VSM) analysis. XRD analysis results revealed that the samples were fabricated in distorted rhombohedral perovskite structure with R3C space group. Also, BiFeO3 (BFO) was formed in a single-phase at 220 °C and 4M concentration of KOH. The magnetic properties of the optimal sample were determined by VSM analysis and very weak magnetic properties were observed in pure nanoparticles. Also, the optical properties and photocatalytic properties of the optimal sample were investigated by UV-visible and Photoluminescence (PL) analysis. The optical gap of BFO was recorded by 2.8 and its photocatalytic properties were investigated at three different pHs (2, 6, and 10) at a concentration of 20 ppm Congo red. The results demonstrated that BFO nanoparticles nearly destroyed dye structure after 120 min at pH = 2.
Graphical Abstract
)
Keywords
Introduction
Multiferroics are materials that can have two or more ferroic orders at the same time. Ferroic orders include four orders: ferromagnetic, ferroelectric, flexural, and ferrotoroidic [1]. Among the multiferroic materials, bismuth ferrite with the chemical formula BiFeO3 (BFO) has received a lot of attention due to its Multiferroics at room temperature. It is a strong ferroelectric with a Curie temperature (TC = 1103 K) and an antiferromagnet with a Neel temperature of (TN = 643 K) [2]. The microscopic source of magnetism in this material is due to the magnetic moment of unpaired electrons in the d orbital of the element iron. Its ferroelectric order is due to ions. Accordingly, in the electrical structure of these ions, 6s unbonded electron pairs do not contribute to the chemical bond; in the electrical structure of these ions, the 6s unbonded electron pair has no share in the chemical bond, and by being organized in one direction, they will cause polarization [3]. Also, the crystal structure of this ferrite is in the form of distorted rhombohedral perovskite (ABO3) with the R3C space group [4]. Recently, BFO has been used as a promising photocatalyst in the visible region due to its suitable optical bandgap (2.2-2.8 eV), good chemical stability, and inherent electrical polarization [5]. Therefore, due to its small band gap, BFO can be used as photocatalysts of visible light and the production of hydrogen from the decomposition of water and organic pollutants. The development of efficient photocatalysts for environmental applications such as air purification (filtration) and water purification are of particular importance since they do not need any external energy source except light. In recent years, many experiments have shown that BFO can effectively eliminate organic substances [6]. Various methods including the sol-gel [7], and the co-precipitation [8], and the sucrose-assisted combustion [9] have been used to synthesis this ferrite. However, some works have been done on this ferrite such as Chao Chen et al. [10] obtaining pure BFO crystalline particles at temperatures above 200 °C and a concentration of 4 M. HuhanSeung et al., [11] investigating the impact of different reaction temperatures and KOH concentrations on the structure of BFO, which reported single-phase BFO particles were formed at a concentration of 8 M and reaction temperatures of 175-225 °C in 6 h. Juang Wang et al., [12] prepared nano- and sub-micro-sized BFO in different concentrations of KOH, NaOH, and LiOH as a reducing agent at 180 °C for 16 h, and certain concentrations of different reducers were able to produce pure BFO. Ismaili et al., [13] prepared BFO particles by nitrate citrate at 650 °C and investigated its photocatalytic properties in methyl orange dye at 9 ppm and pH 2, 6 and 10, under sunlight for 120 min. They reported almost complete degradation at pH = 2. Our studies show that so far, the single-phase of the BiFeO3 nanoparticle by the hydrothermal method has been not fabricated. Also, the photocatalytic and the optical properties of pure BFO nanoparticles are almost non-existent. Therefore, in this paper, the effect of KOH concentration and temperature of the reaction on morphology, particle size, and phase of the prepared BiFeO3 nanoparticle as well as the structural, magnetic, optical, and photocatalytic properties of pure BFO has been investigated.
Experimental details
Bismuth ferrite particles were prepared using hydrothermal method at different concentrations of KOH (4, 8, and 12 M) at 180, 200, and 220 °C and reaction time of 6 h. First, we used the required amount of KOH in deionized water and was placed it on a magnetic stirrer to obtain a homogeneous solution, followed by and dissolving it. We added the amounts of bismuth nitrate and iron nitrate to the desired solvent and allowed it to obtain a uniform solution. The material was then transferred to an autoclave and placed at different temperatures for 6 h. After the autoclave was cooled to room temperature, the material was washed several times with water and 10 % acetic acid and dried in an oven at 90 °C.
Instrumentation
In this study, the following measurement tools were used to characterize and measure the samples. To obtain the X-ray diffraction patterns of the samples, we applied the Philips PW-1830 diffractometer with a single beam Cu lamp with a wavelength of 1.54 angstroms. To identify the type and intensity of bonds from the Fourier transform infrared spectrometer model BOMEN/MB101 made by ABB Company in the wavelength range of 400 cm-1 to 4000 cm-1 was utilized. The morphology and microstructure of the prepared BiFeO3 nanoparticles using FESEM (TESCAN) and Transmission electron microscopy (TEM) with the ZEISS model were investigated. The magnetic hysteresis loop from which the magnetic parameters have been determined was performed using a vibrating sample magnetometer (AGFM/VSM 3886) with a maximum applied field of nearly ± 15 kOe at room temperature. Also, the absorption device, model Cintra_V_3943 was used for UV-visible analysis. Photoluminescence (PL) spectra of the products were recorded by a fluorescence spectrometer (Lumina; Thermo Fisher Scientific).
Results and Discussion
A. Structural analysis
The crystal structure of prepared samples was determined by X-ray diffraction. Figures (1-3) reveal the BiFeO3 diffraction pattern at 180, 200, and 220 °C and different KOH concentrations of 4, 8, and 12 M by hydrothermal method with a reaction time of 6 h. The BiFeO3 diffraction pattern is determined by comparing the obtained diffraction patterns with the standard card (JCPDs: 01-086-1518). The results demonstrated that samples formed a distorted rhombohedral perovskite structure with the R3C space group. Figure 1 shows the diffraction pattern of the BiFeO3 at different temperatures of 180, 200, and 220 °C with different KOH concentrations of 4 M by the hydrothermal method with a reaction time of 6 h. XRD results in Figure 1 also showed that pure (single-phase) BFO was obtained at a concentration of 4 M and a temperature of 220 °C. The relatively sharp peaks obtained for BFO particles indicated the high crystallization of the final products. However, small amounts of impurities such as Fe2O3, Bi2O3, and Bi2Fe4O9 were observed in the final products at some concentrations and temperatures. The diffraction patterns showed that peaks around 53 and 54 degrees could be seen in BFO. These peaks are related to the formation of the secondary phase of Bi2Fe4O9, which is formed due to faster evaporation of bismuth than other elements and the addition of iron during the synthesis process. As the reaction temperature increases, these peaks decrease. The structural characteristics of the samples, such as the average size of the nanocrystals (B), were calculated using the Scherr relation (1):
In relation (1), λ is the wavelength of the X-ray (λ = 1.54 Å), B is the crystal size, θ is the angle between the radiation beam and the particle, and L is the peak width at half of the height [14]. The average size of nanocrystals for our optimal sample is 36 nm.

Figure 1. XRD diffraction pattern of the BiFeO3 with a 4M concentration at temperatures of 180, 200, and 220 °C
The presence of a suitable amount of KOH and temperature in the synthesis process prevents the formation of secondary phases of the impurity and thus the growth of BFO powders towards single-phase perovskites. Based on Figure 1 at a concentration of 4 M, increasing the temperature has reduced impurities, especially Bi2O3.
The same trend was observed for concentrations of 8 and 12 M in Figures 3 and 2. Also, by comparing the samples prepared at the same temperature and different concentrations, it was observed that with increasing the KOH concentration, the removal of impurities did not change significantly.

Figure 2. XRD diffraction pattern of the BiFeO3with a 8 M concentration at temperatures of 180, 200, and 220 °C

Figure 3. XRD diffraction pattern of the BiFeO3 with a 12 M concentration at temperatures of 180, 200, and 220 °C
Figure 4 shows the FT-IR spectra of samples made at concentrations of 12, 8, and 4 M and a temperature of 220 °C. As shown in Figure 4, sharp peaks in the range between (1700-400) cm-1 are related to the bonds in metal oxides. Antisymmetric and flexural tensile bond of Fe-O in the range of (600-400) cm-1 is the characteristic of FeO6 groups in perovskite systems. Absorption bonds around 450 cm-1 and 815 cm-1 are related to Fe-O tensile vibrations and absorption bonds around 550 cm-1 are related to flexural vibrations O-Fe-O, which is an octagonal feature of the FeO6 group in perovskite structures, hence, all samples made in this study have a perovskite structure, which is fully consistent with the single phase of the samples in the diffraction pattern. Also, the absorption bond around 1398 cm-1 is related to tensile vibrations (NO-3). The broad absorption band around (3000-3600) cm-1 is also related to the O-H tensile vibrations in some samples, indicating the presence of moisture in the sample. Since the depth of the valleys indicates the number of bonds in each sample and that this depth is greater in a sample made in 4 M concentration, it shows the sample made at this concentration has a structure with very few defects [15-16].
Figure 5 reveals the FE-SEM images of the BFO nanoparticles synthesized at 220, 180, 200 °C and a concentration of 4 M KOH. As seen in Figure 5, at a specific concentration of 4 M, the increase in temperature has led to formation of structures with more regular shapes and a high specific surface area. Figure 6 shows images of BFO particles at a reaction temperature of 220 °C with concentrations of 4, 8, and 12 M at 6 h. As shown in Figure 6, with increasing KOH concentration, a decrease in particle size was observed. As seen in these pictures, BFO nanoparticles have a strong tendency to agglomerate, and the aggregation of the grains is due to the high surface energy of the nanoparticles. If a clumping process occurs for a nanocatalyst, its activity is significantly reduced.
Figure 7 shows a TEM image of BFO particles at 220 °C with a concentration of 4 M, according to that particle size is less than 50 nm the nanoparticles and BFO powder granules and correspond to the particle size seen in Figure 5 (C) included in Figure 5.

Figure 4. FT-IR spectra of the BiFeO3with a temperature of 220 °C at concentrations of 4, 8, and 12 M

Figure 5. FESEM images of the BiFeO3with a 4 M concentration of KOH at reaction temperatures a) 180, b) 200, and c) 220 °C

Figure 6. FESEM images of the BiFeO3 at reaction temperature 220 °C with different concentrations of KOH a) 4 M, b) 8 M, and c) 12 M

Figure 7. TEM image of the BiFeO3 at 4 M concentration and a reaction temperature of 220 ° C
B. Magnetic properties
Figure 8 shows the magnetization hysteresis loop of the optimal BFO sample obtained at 220 °C and 4 M concentration. According to this curve, the saturation magnetization (MS) is equal to 0.148 (emu / g) and the remanence magnetization (Mr) is equal to 0.00366 (emu / g), also the magnetic coercivity (HC) is equal to 185.89 (Oe). The small amounts of these magnetic quantities indicate that BFO has poor magnetic properties, agreeing with other reports [17, 18]. One of the ways to improve the increase of its magnetic properties is to contaminate this ferrite with magnetic materials [19]. The reason why this magnetism does not appear in a large form is due to the spiral structure of the spins. This way if the size of the prepared sample grains is less than the rotational spin period then prevents the spin rotational period and the spin-orbit coupling in the BiFeO3 (λ = 64-62 nm) as a result has increased macroscopic magnetization in the samples. In the localized state, the antiparasitic magnetic subnetworks in the BiFeO3 building are tilted relative to each other, due to the Dzyaloshinskii-Moriya interaction, which is a combination of the exchange interaction and spin-orbit coupling, and tilting the subnets will cause a weak ferromagnetic torque [20, 21]. Another way the change in the bond angle of the O-Fe-O leads to greater distortion andasymmetry in the samples and increases their magnetic properties. Also changing the structure from the rhombohedra to the orthorhombic could increase their magnetic properties [19].

Figure 8. Magnetic hysteresis loop of the BiFeO3 at 4 M concentration and a reaction temperature of 220 °C
C. Iinvestigating UV-visible and photoluminescence analyzes
The most important parameters that from optical absorption properties can be
determined are the bandgap and electronic structure features. Also, the study of the optical properties at room temperature such as absorption and bandgap energy is of great importance in optoelectronics applications. To investigate the absorption spectrum and calculate the bandgap, a UV-visible spectrum in the wavelength range of 200-800 nm was prepared for BFO nanoparticles. For this purpose, 0.01 g of synthesized BFO was sonicated in 10 mL of ethanol for 30 min and then its absorption spectrum was measured.
The results of the UV-visible analysis of BFO are shown in Figure 9, obtained from diagram of (ahν)2 in terms of hν, and the BFO absorption spectrum is scaled down. To determine the optical gap of the sample, we relied on the UV-visible analysis data shown in Figure 9 and the TAUC relation, where is linear absorption coefficient, is the photon energy, K is the constant coefficient, n = (1/2, 1, 2) is the constant dependent on the degree of transition, and Eg is the bandgap [22]. The amount of band gap for pure BFO was approximately equal to 2.8 eV, which is acceptable according to the reported information [23, 24].
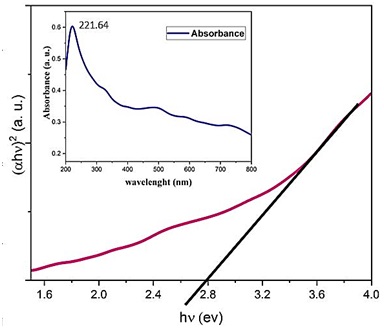
Figure 9. Diagram of (𝛼ℎ𝜐) 2 in terms of h𝜐 for prepared the BiFeO3 at a concentration of 4 M and a reaction temperature of 220 °C
A photoluminescence device was used to investigate the BFO bandgap. In photoluminescence spectroscopy, when light with sufficient energy is radiated on the BFO, photons are absorbed, electron excitation occurs, and the electrons return to their original state; the emitted light is called PL. Figure 10 demonstrates the photoluminescence spectra of BFO using a xenon lamp as the excitation source with an excitation wavelength of 297 nm. As can be seen from Figure 10, a sharp peak for pure BFO was formed around 437 nm, which indicates rapid recombination of the electron-hole pair. One of the reasons leading to rapid recombination electron-hole pair and thus a strong emission in the photoluminescence spectrum is the small distance between the valance band and the conduction band in the BFO. This issue is a reason for the BFO's poor performance in photocatalytic activity and methods, for example doping other elements into the BFO can create sites near the conduction band to trap excited electrons and improve the BFO's photocatalytic activity. Also, using the emission wavelength obtained from the photoluminescence spectrum, the BFO bandgap could be calculated using the following relation:
![]()
The obtained value for the BFO band gap is of 2.8 eV. This number is compared with the optical gap 2.8 eV, which agrees with what is expected.

Figure 10. The BiFeO3 photoluminescence spectrum was prepared at a concentration of 4 M and a reaction temperature of 220 °C
We chose Congo red as dye pollution to measure the photocatalytic activity of the prepared BFO nanoparticles. To assess the photocatalytic properties of BFO nanoparticles at three pH = 2, 6, 10; a Congo red dye solution was prepared with a concentration of 20 ppm and the desired pH. Then, produced nanoparticle was added to each solution with different pH by a concentration of 5 mg/mL in the stirring dye solution. During the photocatalytic process, it was placed in a photoreactor. The mixture was first magnetically stirred in the dark for 45 minutes to establish adsorption-desorption equilibrium and then irradiated by Xenon 150W lamp at 5 cm from the sample. Next, 5 mL of solution was picked up every 30 minutes and the catalyst were removed by centrifuging. The UV-visible spectrophotometer was used to determine the concentration of the solution. Throughout the irradiation, the suspension was placed on the stirrer at 600 rpm.
The absorption and desorption equilibrium of Congo red by BFO in the dark was 45 min, so the equilibrium time was 45 min. After equilibration, the sample was exposed to visible light for 120 min.
Figure 11 reveals the reduction of Congo red concentration by pure BFO nanoparticles exposed to visible light. As seen in Figure 11, the dye concentration at pH = 2 completely disappeared.

Figure 11. Congo red absorption diagram of the BiFeO3 at pH = 2 with a 4 M concentration and a reaction temperature of 220 °C
Figure 12 shows the final concentration on the initial concentration of dye in terms of duration radiation visible light (C/C0) at pH = 2, 6, and 10 for pure BFO. As can be seen, the highest rate of degradation was related to pH = 2, which was completely degraded after 120 min, but the decomposition of dye at pH = 6 and 10 did not change much, which is not an acceptable result for us. So, it could be said that due to the anionic dye of Congo red, its rate of decomposition in acidic medium is higher than that of other environments and the rate of absorption and decomposition of dye in acidic medium is higher. As a result, photocatalytic activity does not occur well in other mediums (pH = 6, 10) and Congo red dye does not decompose well. Table 1 provides a comparison with previous work [25-29], although no studies have been performed on different pH colors of Congo red by BFO. Further, the kinetics of the photodegradation was evaluated by a postulated first-order reaction kinetic model and the following equation was used:
![]()
Where, C0, C, and k are initial concentration, concentration after a time of t for Congo red, and constant rate of decomposition, respectively [30].
Figure 13 shows the logarithmic variations of the relative Congo red concentration over time of the process. The rate of dye decomposition by nanoparticles is determined at different pHs according to the slope of the graphs. The decomposition rate constant at pH = 2 is 0.016 min-1, which is 0.00077 min-1 and 0.0031 min-1 for pH = 6 and 10, respectively. The linearity of these variations means that the Congo red decomposition follows the first-order Langmuir-Hinshelwood kinetics with a good approximation.

Figure 12. C/C0 diagrams in terms of visible light irradiation time for Congo red at pH = 2, 6, and 10 for prepared BiFeO3at 4 M and a reaction temperature of 220 °C

Figure 13. Diagram of LnC/C0 in terms of visible light irradiation time for Congo red at pH = 2, 6, and 10 for prepared BiFeO3 at 4 M and a reaction temperature of 220 °C
Conclusions
In this research study, a single-phase BiFeO3 nanoparticle was prepared using the hydrothermal method. It was observed that the formation of single-phase BFO and the absence of impurities is completely dependent on the KOH concentration and reaction temperature. According to the XRD results, the pure phase of bismuth ferrite (BFO) has been prepared at a concentration of 4 M and a reaction temperature of 220 °C. FESEM images also showed an increase in the temperature has led to the formation of structures with particles smaller and more regular shapes. As shown in these images, by increasing KOH concentration, a decrease in particle size is observed, also, the average for the particle sizes is less than 50 nm that corresponds to the TEM image. FT-IR analysis also showed that BFO was prepared with perovskite structure and very low defects at a concentration of 4 M KOH. Its magnetic and optical properties were investigated at different pHs. It was observed that BFO had weak magnetic properties with a bandgap of 2.8 eV. Also, pH = 2 showed the highest rate of Congo red dye degradation.
Disclosure statement
No potential conflict of interest was reported by the authors.
)