Document Type : Original Research Article
Authors
- Khalifa Sunusi Aminu 1, 2
- Adamu Uzairu 1
- Stephen Eyije Abechi 1
- Gideon Shallangwa Adamu 1
- Abdullahi Bello Umar 1
1 Department of Chemistry, Ahmadu Bello University, Zaria, Nigeria
2 Department of Pure and Industrial Chemistry, Bayero University, Kano, Nigeria
Abstract
This study employed quantitative structure-activity relationship (QSAR) to predict the inhibitory activities of N-(alkyl/aryl)-2-chloro-4-nitro-5-[(4-nitrophenyl) sulfamoyl] benzamide derivatives as potent inhibitors of C-terminal human intestinal maltase-glucoamylase (MGAM-C). Density Functional Theory with B3LYP/6-31G* as the basis set was used to optimize the chemical structures of the derivatives. Genetic function approximation generated three models, with model one having validation keys of R2int= 0.989, R2adj = 0.984, Q2cv = 0.974, and LOF = 0.0056 being selected as the best due to it highest external validation parameter of R2ext = 0.722. The ligand-based approach designed four compounds with higher activities than the lead compound. The binding interactions of the designed compounds within the active site of (MGAM-C) revealed interesting MolDock scores. This research concluded that the designed compounds from the derivatives could serve as potent inhibitors of MGAM-C, offering valuable insight into developing novel medications to treat diabetes mellitus.
Graphical Abstract
)
Keywords
- Quantitative structure activity relationship
- Antidiabetic agents
- Molecular docking
- Molegro virtual docker
- Density functional theory
Main Subjects
Introduction
Insulin secretion and action deficiencies can cause elevated blood sugar levels, resulting in a serious metabolic disorder known as “Diabetes mellitus”. The disease is categorized into gestational, Type I, and Type II, with polyuria, polydipsia, and polyphagia recognized as the significant etiologic symptoms of the disease [1]. The International Diabetes Federation estimated that in 2011, 366 million people had diabetes mellitus and that by 2030, 552 million people will have it. Furthermore, it is estimated that about 425 million adults were diagnosed with the disease. The figure is projected to increase to about 700 million patients by 2045 if no intervention exists [2]. Type II diabetes mellitus (T2DM), one of the most prevalent DM, is characterized by insulin resistance due to reduced glucose uptake in the target tissues [3]. The process reduces insulin production from the β-cells of Langerhans of the pancreas, which finally results in the accumulation of the blood glucose level (hyperglycemia) [4]. Hence, the pathogenies of the disease are interwoven with various mechanisms of insulin secretion and insulin sensitivity, in addition, to decreasing glucose reabsorption through carbohydrate digestion and increased peripheral glucose uptake [5].
The treatment of T2DM involves the use of various anti-diabetic agents that work in different ways to regulate blood sugar levels. In addition to the medications, dietary and lifestyle modifications have been found to be important in managing the condition [6]. The drugs used for treatment have been divided into different categories, such as biguanides, sulfonylureas, thiazolidinediones (TZD), meglitinides, Dipeptidyl peptidase (IV) inhibitors, and sodium-glucose co-transporter (SGLT2) [7]. Combining drugs from different classes primarily enhanced treatment outcomes [8]. However, despite pronounced positive efficacies, the anti-diabetic agents are associated with numerous side effects [7]. The observed side effect raised concern and awakened the scientific communities to look inwards at discoveries of new agents [9].
Targeting the enzymes involved in carbohydrate digestion is a highly appealing approach for managing type 2 diabetes mellitus (T2DM) [3]. Inhibition of these enzymes can break down complex sugars into simpler monosaccharides, thus delaying their absorption into the bloodstream [10]. The C-terminal of human intestinal maltase-glucoamylase (MGAM) has been identified as a successful treatment for T2DM. This enzyme, part of the glycoside hydrolase 31 family (GH31), is structurally similar to other α-glucosidases and has been found to be more effective than the standard drug acarbose in inhibiting the wide range of α-glucosidases associated with T2DM. Therefore, MGAM is a preferred option for T2DM management [11].
Benzamide is a carbonic acid amide of benzoic acid, with its derivatives possessing a wide range of pharmacological activities, including T2DM [12]. The biological significance of ones derivatives increases our quest to structurally view ones derivatives and how to improve the scaffold in search of new and more effective drug candidates for T2DM management using quantitative structure-activity relationship (QSAR) and molecular modeling analysis. To this effect, we herein aimed to develop a QSAR model from N-(alkyl/aryl)-2-chloro-4-nitro-5-[(4-nitrophenyl) sulfamoyl] benzamide derivatives and used it to predict the activities of the derivatives. We also designed new structural analogs, evaluated their activities, and conducted molecular docking studies.
Methods
Dataset Generation
Twenty-five derivatives of N-(alkyl/aryl)-2-chloro-4-nitro-5-[(4-nitrophenyl) sulfamoyl] benzamide with antidiabetic activities (IC50) expressed in micromolar (μM) against α-glucosidase inhibitor were obtained from Thakal et al., (2020) [13]. The antidiabetic activities were normalized to the logarithm scale (pIC50) using equation 1 [14].
![]()
Molecular Optimization
The 2D structure of the compounds was drawn using Chemdraw (V12.0.2) software, then converted to 3D format and optimized with Spartan 14 (V1.1.4) to reduce any constraints. The optimization used the density functional theory (B3LYP/6-311G*) as the basis set. The optimized derivatives were then saved in an sdf file format [15].
Computation of Molecular Descriptors
The pharmaceutical data exploration laboratory software (PaDEL) tool kit was employed to determine the molecular descriptors of twenty-five optimized 3D format of N-(alkyl/aryl)-2-chloro-4-nitro-5-[(4-nitrophenyl) sulfamoyl] benzamide [16].
Pretreatment and Splitting of Dataset
Data Pre-treatment software version 1.2 was used to eliminate redundant values and unnecessary descriptors from the data. The Kennard-Stone algorithm was used to separate the dataset into an internal and external validation set, with twenty compounds assigned to the internal set and five compounds assigned to the external set [17].
QSAR Models
The material studio version 8.0 was used to develop a QSAR model applying the genetic function algorithm (GFA) using the internal validation sets compounds. This algorithm has the unique ability to generate multiple models instead of just one. The antidiabetic activities (pIC50) were used as the dependent variable, and the molecular descriptors were used as the independent variable [18].
Validation of QSAR Model
The developed QSAR models were tested on an external set of data that had not yet been used while developing the model. However, the criteria for choosing the optimal QSAR model are outlined by the correlation coefficient of the internal validation set (R2int), adjusted R2, cross-validation coefficient (Q2cv), and correlation coefficient of the external validation set (R2ext), which are all identified in Equation (2, 3, 4 and 5) respectively [15].

where P is the number of independent variables in the model, and N is the sample size. Yexp, Ypred, and Ytrain are the experimental activity, the predicted activity, and the average experimental activity of the compounds in the modeling set, respectively.
Statistical Validation
Mean Effect
The mean effect values numerically represent the influence and contribution of each molecular descriptor used in constructing the model. These descriptors are encoded with the molecule's topological, geometrical, and electronic features, and the values are calculated using equation 6 [19].
![]()
where is the mean effect of a descriptor j in a model, βj is the coefficient of the descriptor j in the model and dij is the value of the descriptor in the data matrix for each molecule in the model building set, m is the number of descriptors that appear in the model and n is the number of molecules in the model building set.
Variance Inflation Factor (VIF)
The VIF measures the degree of inter-correlation among the descriptors in the developed model. It is calculated using equation 7, and values between 1 and 10 are considered acceptable. In contrast, values less than 1 indicate no inter-correlation between the descriptors, and values greater than 10 indicate an unacceptable model. [17].
![]()
Where VIF is the variance inflation factor and R2 is the correlation coefficient of the selected model.
Y-Randomization Test
To ensure that the model created was reliable and the obtainability was not just a coincidence, the validation coefficient for Y-randomization cR2p was evaluated. The Y-randomization test was performed by reshuffling the activity randomly on the model internal validation sets compounds. A new QSAR model is generated and said to be robust only if it has a low R2 value, low Q2 value, and cR2p ˃ 0.5 [20]. The Equation for calculating the cR2p is given as:
![]()
cR2p is the coefficient of validation parameter for Y-randomization, R is the coefficient of determination for Y-randomization, and Rr is the average ‘R’ of random models.
Applicability Domain
Williams plot is a plot of leverage values against standardized residuals for a given set of compounds. It is used to identify compounds outside the scope of a model's applicability i.e., to identify molecules that are either peripheral or influential in affecting the model's performance. The leveraged approach and the warning leverage were assessed using equations 9 and 10, respectively [21].
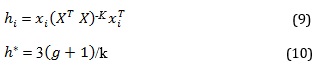
Where is the leverage approach, is the training set matrix, is the n × k descriptor matrix of the training sets, is the transpose matrix used in generating the model, is the warning leverage, is the number of descriptors of the selected model, k is the number of compounds in the training sets.
Ligand-Based Drug Design
The LBDD approach was utilized for the template to design potent antidiabetic compounds. While selecting the template, information about the compounds’ low residual values, good pIC50 values, and applicability domain was considered. This will help in designing novel compounds with higher anti-diabetic activities. Also, mean effects values were considered to get a more promising candidate.
Molecular Docking
Molegro Virtual Docker software (Version 6.0.1, Molegro ApS, Aarhus, Denmark) was used to assess the binding interactions of the designed compounds with the α-glucosidase inhibitor. The compounds were optimized for the most stable energy conformation and saved in a structure data file folder (sdf). The Protein Data Bank database (https://www.rcsb.org/) was used to obtain the human intestinal maltase-glucoamylase enzyme (3TOP) in complex with acarbose as the co-crystallized ligand and reference drug. The protein was imported into the MVD workspace, water molecules and co-crystal ligands were removed from the crystal structure, a surface was created, and cavities were detected. The prepared compounds were then imported into the MVD workspace, and a grid resolution of 0.30Ao, binding site radius of 15Ao, and MolDock score grid as the scoring function were selected. The active site of the protein was predicted and defined within a sphere of X: -28.63, Y:35.51, and Z:34.52 coordinates, while other parameters were kept constant [20]. After the docking procedure, the MolDock score, hydrogen bond interactions, and non-hydrogen bond interactions were evaluated and viewed with Discovery studio version 16.1.0 software. The structural evaluation of the protein’s quality (with/ or without the designed compounds) was investigated using Procheck validation server (https://saves.mbi.ucla.edu) [22].
Results
The inhibitory concentrations of the datasets were normalized, and the residual values were calculated and presented in Table 1. Models were generated using the genetic function algorithm, and the three models generated were displayed thus;
Model 1: pIC50 = - 0.0298 * (ATSC3i) + 0.0174 * (AATSC7m) - 0.1595 * (AATSC7v) - 2.1921 * (MATS3v) + 3.2447 * (SpMin7_Bhs) - 0.1619
Model 2: pIC50 = 0.0002 * (ATSC7m) - 0.0005 * (ATSC3v) - 0.0016 * (ATSC7v) - 0.0270 * (ATSC3i) + 2.1978 * (SpMin7_Bhs) + 0.8928
Model 3: pIC50 = 0.0002 * (ATSC7m) - 0.0015 * (ATSC7v) - 0.0289* (ATSC3i) - 0.0514 * (AATSC3v) + 2.5556 * (SpMin7_Bhs) + 0.5085
Table 1. Structures, experimental pIC50, predicted pIC50 and residuals of benzamide derivatives against α-glucosidase


After generating the models, the models were evaluated by both internal and external parameters. Remarkably, the results of the model validation indicate that the models are reliable and can be used to predict the activity of the compounds. The best and selected model (model one) had an R2ext value of 0.722, within the accepted range. This indicates that the model can accurately predict the compound’s activities (Table 2). Compounds 1, 10, 14, 18, and 19 were the most effective, featuring benzene rings attached to the parent compound, as well as other groups such as chlorine (Compound 10), nitro (Compound 14), nitro and methyl (Compound 18 and 19) (Table 1).
Table 2. Validations of the generated models

Model one was chosen for further investigation after the initial validations. Statistical analysis assessed the correlation between the molecular descriptors (Table 3). The variance inflation factor (VIF) of less than 10 indicated that the descriptors were not correlated (Table 3). The descriptors’ mean effect (ME) values showed ATSC3i, AATSC7v, MATS3v, and SpMin7_Bhs, with positive ME values SpMin7_Bhs having the highest ME value of 0.639. On the other hand, the ME of AATSC7m was -0.013, suggesting a negative influence (Table 3).
Table 3. The Pearson’s correlation, VIF, and ME values of the descriptors utilized in model one

The Y-randomization test was used to further verify the strength of the model, and the results showed that the R2 and Q2 values were 0.197 and -0.589, respectively, while the cR2p was 0.761 (Table 4).
Table 4. Y-randomization result

Using the Williams plot (Figure 1), four compounds from the test set were identified as negatively influencing the model's performance, as they were outside the warning leverage (h* =0.9). These compounds were identified as 1, 18, 19, and 25.
After establishing the applicability domain, compound 10 was chosen as the lead compound (Figure 2a), and the template was adopted (Figure 2b) for ligand design. Different groups were added to the template’s P, Q, R, and S positions. Model one was used to predict their activities.
Out of the designed compounds, four had a predicted pIC50 that was higher than that of the lead compound (Table 5). These compounds had values ranging from 4.432 to 4.695, with compound C2 having the highest value of 4.695. The template used was tested with both electron donating-withdrawing groups. The predicted activities of the designed compounds were enhanced when electron-withdrawing groups were used.
 Figure 1. Williams plot of model one
 Figure 2. A: Molecular structure of lead compound, B: Molecular structure of the adopted template
Table 5. The predicted pIC50, MolDock score, and H-Bond Energy of the lead, designed compounds, and acarbose

Molecular docking studies were conducted to assess the interaction between the compounds and the (MGAM-C). As indicated by the Moldock scores in Table 5, the results suggest that the designed compounds could interact with the enzyme at its active site (MGAM-C) (Figure 3).
 Figure 3. The MGAM-C structure shows the active site where docking was conducted
The MolDock scores of the compounds were arranged in the following order: C1 (-128.8) < C3 (-134.6) < C2 (-136.7) < C4(-156.5). The lead compound and acarbose had MolDock scores of -129.7 and -102.5, respectively (Table 6, Supplementary file).
Further docking results were analyzed using Discovery Studio Visualizer to develop a visual representation. Notably, Compound C1 interacted with Trp1369 and Ile1587 residues of the protein through conventional hydrogen bond interactions, respectively (Figure 4a). Similar interactions with Tyr1251 and Trp1355 residues were observed in compound C2 (Figure 4b), while only a single H-bond interaction with Thr1586 residue was observed in compound C3 (Figure 4c). Also, Compound C4 was bound to the protein via three conventional H-bond interactions with Gln1372, Arg1377, and Thr1586 residues, respectively (Figure 4d). In addition to the H-bond interactions, halogen, two Pi-sulfur, alkyl, and Pi-alkyl interactions with Asp1562, Trp1355, Phe1560, Ile1587 and Phe1560 residues of the protein were observed with compound C1 (Figure 4a). Similarly, two carbon-hydrogen bonds, Pi-sulfur, two Pi-Pi T-shaped, alkyl and three Pi-alkyl with Gly1365, Gly1365, Phe1560, Trp1355, Phe1559, Ile1587, Trp1355, Trp1369, and Ile1587 residues were observed with compound C2 (Figure 4b). Moreover, Pi-sulfur, three Pi-Pi T-shaped and Pi-alkyl with Phe1560, Tyr1251, Trp1355, Phe1559, and Trp1369 residues were noticeable with compound C3 (Figure 4c). In contrast, one carbon-hydrogen bond, Pi-cation, two Pi-sulfur, three Pi-Pi T-shaped, alkyl and three Pi-alkyl with Gly1365, Arg1377, Phe1559, Phe1560, Tyr1251, Trp1355, Phe1559, Val1363, Trp1355, Trp1369, and Trp1369 residues were observed with compound C4 (Figure 4d). Noticeably, the lead compound and acarbose formed three and six H-bond interactions with the protein, respectively (Figures 4e and 4f). A halogen, Pi-donor, and Pi-Pi stacked interaction in the lead compound and three carbon-hydrogen and Pi-alkyl interactions with acarbose were also prominent (Figures 4e and 4f).
The structure of the MGAM-C and in complex with the designed compounds were evaluated using Ramachandran Plots. The enzyme showed 79.9%, 18.5%, and 1.4% of amino acid residues in the most favored, additionally allowed, and generously allowed regions, respectively (Figure 5), while only 0.1% of the residues were found in the disallowed region (Figure 5, Supplementary file).
 Figure 4. Structural interactions of MGAM-C in complex with compound C1(a), compound C2(b), compound C3(c), compound C4(d), lead compound(e), and acarbose(f)
Discussion
The worldwide rise in people with Type 2 Diabetes is a cause for concern [23]. The numerous drawbacks of synthetic hypoglycemic agents and their expensive nature demand the search for new drug candidates [24]. In this study, the N-(alkyl/aryl)-2-chloro-4-nitro-5-[(4-nitrophenyl) sulfamoyl] benzamide derivatives were found to have considerable in-vitro activity against α-glucosidase [13]. This prompted a QSAR analysis of the derivatives and the design of potent compounds from the derivatives which could act as α-glucosidase inhibitors.
A genetic function algorithm was used to generate the QSAR models. This is because the GFA allowed for greater flexibility by providing a range of models to choose from rather than just one [20]. Furthermore, the models were validated to evaluate their accuracy and determine their potential to increase the biological activities of compounds [21]. Based on the R2ext value, model one was not over-fitted and had better predictive capabilities for designed compounds than the other models. The statistical assessment of the model was also astonishing. The encoded descriptors based on the molecules' topological, geometrical, and electronic status indicated positive correlations with appreciable steric and electrostatic interactions based on the VIF and ME, respectively [21]. The higher ME value of the SpMin7_Bhs descriptor could lead to a marginal elevation in the activities of the compounds, while the negative value of the AATSC7m descriptor indicates otherwise. Also, the cR2p of 0.71 obtained showed that the model was robust. This is because the suggested value for the parameter is higher than 0.5 [25].
After validating the model, William's plotting was used to identify any compounds that could have a negative effect on the model's performance. Compounds 1, 18, 19, and 25, although within the standardized value of -3 and +3, were located outside the desired domain and had a negative impact on the model's performance. The differences in the position of attachments and the attached groups may cause these compounds to be outside the desired domain, and thus they cannot be considered for drug design.
The Williams plot was used to identify outliers and assess the model's performance. Compound 10 was chosen for generating the designed compounds due to its low residual value and good pIC50 value. Substitutions of electron-withdrawing and -donating groups at different positions were made to the compound to increase its activity. These substitutions were successful, as four of the compounds designed possessed the highest activities relative to the lead compound when bromine, methoxy, and nitro groups were attached. This indicates that these substitutions were successful in increasing the compound's activity. Furthermore, none of the calculated leverage values exceeded the warning leverage, indicating that the compounds designed are within the applicability domain.
The docking studies of the four designed compounds against MGAM-C were conducted. The docking studies normally give insights into a ligand’s possible interaction with a receptor in drug design and discovery [26]. Although there was inconsistency between the pIC50 and the MolDock score, enhanced binding interaction between the compounds and the protein was observed, respectively. The moldock score is a parameter that gives information on the binding energy of the interactions [27]. The interactions of the compounds with Tyr1251, Asp1562, Trp1355, Trp1369, and phe1560 were observed. These residues play essential roles in the active sites of the protein [11]. For instance, the bulk side chain of Tyr1251 was involved in stabilizing the first sugar ring of acarbose, while phe1560 stabilized the fourth ring of acarbose by hydrophobic interactions, respectively [11]. Significantly, Asp1562 residue is involved in the catalytic reaction [11]. Compound C4 has the highest score among the designed compounds, hence could serve as a promising target against MGAM-C. Evaluation of the MGAM-C showed the structural integrity of the protein not to be affected in the presence of the designed compounds. This is because the % of the amino acid residues within the Ramachandran plot’s region was not affected even in the presence of the compounds. Hence, the Ramachandran plot serves as an essential tool for the determination of the protein structure [28].
Conclusions
The results of the current study are very promising and suggest that model one, developed from Genetic function approximation, is the most successful. It had the highest fitness with the validation parameters of R2int = 0.989, R2adj = 0.984, Q2cv = 0.974, LOF = 0.0056, and R2ext = 0.722. The VIF value of less than ten and the mean effect values of model one also indicated the model’s reliability based on its predictive power. Furthermore, the four compounds designed using the ligand-based method were found to have higher activities than the lead compound and interacted well with the active site of the MGAM-C. These findings suggest that the designed compounds could be used to search for a new anti-diabetic agent. This is an important step forward in the development of new drugs for the treatment of diabetes.
List of Abbreviations
QSAR: Quantitative Structure Activity Relationship; B3LYP: Bee – 3 – Lee Yang Par; GFA: Genetic Function Approximation; DFT: Density Functional Theory; ME: Mean Effect: MVD: Molegro Virtual Docker; PaDEL: Pharmaceutical Data Exploration Laboratory; ADMET: Absorption, Distribution, Metabolism, Excretion, and Toxicity
Acknowledgment
The author sincerely acknowledged all the contributors for their support, supervision and motivation during the research work and also acknowledged Ahmadu Bello University for providing the softwares used for the research.
Disclosure statement
The authors declare that they have no conflict of interest.
Orcid
Khalifa S. Aminu : 0009-0000-4966-0454
Adamu Uzairu : 0000-0002-6973-6361
Gideon A. Shallangwa : 0000-0002-0700-9898
Abdullahi B. Umar : 0000-0003-0984-5969
HOW TO CITE THIS ARTICLE : Khalifa Sunusi Aminu *, Adamu Uzairu, Stephen Eyije Abechi, Gideon Adamu Shallangwa, Abdullahi Bello Umar. A Search for Novel Antidiabetic agents using Ligand-Based Drug Design and Molecular Docking Studies Employing Human Intestinal Maltase-Glucoamylase as Model Enzyme. Adv. J. Chem. A, 2023, 6(2), 155-171.
DOI: 10.22034/AJCA.2023.387041.1355
)