Document Type : Original Research Article
Authors
1 Department of Chemistry, Bonab Branch, Islamic Azad University, Bonab, Iran
2 Department of Chemistry, Faculty of Basic Sciences, University of Maragheh, Maragheh, Iran
Abstract
Photocatalytic degradation of organic chemicals such as dyes over semiconductor nanostructures is one of the most effective processes for eliminating them from wastewater. In this study, X-ray diffraction (XRD), scanning electron microscopy (SEM), and photoluminescence were used to examine the physicochemical properties of nitrogen-doped TiO2(N/TiO2) photocatalysts. According to the XRD results, the nanoparticles have similar crystal structures as pristine TiO2. The photocatalytic properties of N/TiO2 nanocatalysts at various catalyst concentrations were used to investigate the dye Blue 5's visible light degradation. DRS results show that the absorption band of the doped photocatalyst is shifted toward the visible region, and its bandgap is smaller than that of undoped TiO2. According to DFT calculations, N-doping causes TiO2's band gap value to decrease because the band gap's center is closer to the valence band. For pure and N/TiO2 nanostructures, there is a good agreement between DFT and experimental values of the pristine and N-doped TiO2 band gap.
Graphical Abstract
)
Keywords
Main Subjects
Introduction
In recent years, significant efforts have been made to develop novel methods for cleaning polluted water due to growing industrial waste, including organic contaminants [1]. Consequently, such compounds should be removed from the environment. Various methods are used to remove dye contaminants, including membrane processes, biodegradation, reverse osmosis (RS), coagulation, ion exchange, oxidation processes, and adsorption [2]. Gharbani et al. have investigated the efficacy of polyaniline tin (II) molybdophosphate in removing the malachite green dye at various adsorbent doses, pH values, dye concentrations, and temperatures [3]. Furthermore, the adsorption of a reactive P2B red dye (RR-P2B) onto montmorillonite layers (MMT), a cheap inorganic clay, has been carried out [4].
Dye degradation and wastewater treatment have also benefited from advanced oxidation processes (AOPs) [5-7]. The construction of a highly reactive hydroxyl radical capable of oxidizing an extensive range of organic compounds is the foundation of the AOPs mechanism. Mixed photocatalysis has been broadly used to degrade organic compounds from aqueous solutions among the various AOPs [8]. Recently, graphene oxide-modified nano-Ag/Ag3VO4/AgVO3 was synthesized as a visible-light-sensitive photocatalyst, and the photodegradation of the pigment Reactive Orange 16 was investigated with the AOPs method [9]. Titanium dioxide (TiO2) is the principal material usually utilized in the photocatalytic treatment of poisons, compared to other metal oxide semiconductors, due to its minimal expense, high reactivity, and non-harmfulness. TiO2 likewise has a high electron-hole recombination rate, which lessens its photoactivity. Accordingly, forestalling the recombination of photogenerated electron-/opening matches in TiO2 is vital to improving photocatalytic performance [10]. However, pure TiO2 is only active when exposed to ultraviolet (UV) light (Eg= 3.2 eV), which makes it ineffective in absorbing visible light [11]. Two factors primarily influence TiO2's photocatalytic activity: inhibiting the electron-hole recombination rate and reducing the visible band gap energy. One method for overcoming such limitations is chemical doping. Using chemical doping, the band gap energy of TiO2 is changed, allowing the absorption band to shift to the visible region [12,13]. Many efforts have been made to increase the sensitivity of modified TiO2, such as doping with transition metals, nonmetal atoms, and organic materials, to enhance photocatalysis activity. Non-metallic material replacement doping, for example, C [14], N [15], S [16], I [17], and P [18], seems a very promising way to improve the optical properties of TiO2. Recent photocatalyst research has concentrated on synthesizing N-doped TiO2 (N/TiO2) in particular [19]. Various TiO2 doping methods have been suggested in the literature, including sol-gel reaction, ion implantation, solid-state reaction, hydrothermal reaction, and so on [20,21], with the sol-gel approach being modest and least expensive for low-temperature N/TiO2 synthesis.
Computational methods are beneficial for experimenters to understand the behavior of various compounds [22]. Therefore, various theoretical and experimental studies on materials have been carried out [23–27]. Ebrahimzadeh-Rajaei et al. have studied the drug delivery behavior of the fullerene nanoclusters [28,29] and anticancer nano drug carriers of boron nitride nanoclusters [30]. In our previous work, the structural and optical properties Study of Ag and Mg co-doped TiO2 by comparing DFT calculation with experimental results have been reported [31].
The photophysical properties of a newly created class of TiO2 nanoparticles doped with nitrogen at low temperatures are described in this paper. N-TiO2 particles were successfully synthesized using the sol-gel method. The findings showed that N-TiO2 nanoparticles manufactured in this manner had significantly increased the photodecomposition activity of organic toxins. The structural characterizations of the synthesized catalysts were studied utilizing X-ray diffraction (XRD), and scanning electron microscopy (SEM), then the optical properties of the prepared catalysts were investigated using photoluminescence (PL) and UV–Vis diffuse reflectance spectroscopy (DRS). In the current investigation, the density functional theory (DFT) calculations were also performed to provide additional information about the electronic structural properties of the N-doped TiO2.
Experimental Method
Materials and methods
Titania predecessor was titanium tetraiso-propoxide (Ti(OC3H7)4). Ethanol (EtOH) had a purity of 95%, and aqueous ammonia solution (28 Wt.%) and nitric acid (HNO3) had a purity of 95%. All compounds were obtained from Merck (Germany).
Dye
Sigma-Aldrich provided the reactive Blue 5 dye (C29H17ClN7Na3O11S3) with a molecular weight of 774.16 g/mol and a maximum absorbance wavelength of 597 nm used in this study with its molecular formula. Figure 1 reveals this dye's chemical composition.
Light sources and photoreactors
The batch reactor with a one-liter volume was used, and the source of visible light was a 500W halogen lamp (Osram).
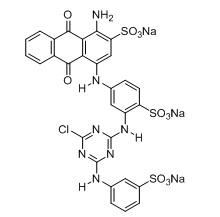 Figure 1. Chemical structure of reactive Blue5 (C29H17ClN7Na3O11S3)
The N/TiO2 catalyst preparation
A sol-gel method was used to make the nitrogen-doped titania nanocatalysts. 10 mL of Ti [OCH (CH3)2]4 (Aldrich, 97%), 40 mL of ethanol, 10 mL of aqueous ammonia solution (28 percent by weight), and 2 mL of HNO3 were combined in the mixture of 40 mL of ethanol and 10 mL of aqueous ammonia solution. The blend was strongly stirred with a magnetic stirrer throughout the addition and for another 2 hours at room temperature after the precursor was added. The result was a colloidal solution of TiO2 nanocrystals. After centrifugation, an ashen powder was attained, and the sol was dried for 6 h. A powder of light-yellow color was produced when the dry solid was calcined for four hours in a furnace at 400°C. Pure TiO2 nanocrystals were produced using the same procedure lacking the use of ammonia during the hydrolysis of the titanium precursor.
Characterization
Cu–K radiation recorded between 20 and 70 degrees Celsius was used to record XRD shapes for phase detection and crystallite size measurement on a Siemens D5000 XRD. Scherrer's equation, Eq. (1), was used to calculate the normal crystallite size, D in nm:
D= kλ/βcosθ (1)
where k is a constant equivalent to 0.89, λ is the X-ray wavelength equivalent to 0.154056 nm, β is the full width at half maximum intensity, and θ stands the half diffraction angle [32]. A Philips apparatus modeXL30 was used to conduct SEM research on Au-coated samples. The TOC analyzer (Shimadzu TOC-Vcsn) was used to take samples of total organic carbon (TOC). Avaspec-2048 TEC spectrometer was used to obtain the DRS of the samples in order to evaluate the catalysts' optical band distance (Eg).
The band gap energies (Eg) of all samples were calculated using the equation below:
Eg (eV) = 1240/λ (nm) (2)
JASCO luminescence spectrometer with a 320 nm excitation wavelength was used to measure the samples' photoluminescence emission spectra.
Determination of Photocatalytic Activity
Blue 5 dye decomposition underneath visible light was used to assess the photocatalytic activities of nitrogen-doped TiO2 photocatalyst. A Batch reactor was used for all photocatalytic tests, which was loaded through 100 mL of the photocatalyst's suspension of Blue 5 (20 mg/L). As the light source, a visible lamp was used. Preceding radiation, the suspension was magnetically stirred for about 30 minutes in the murky to guarantee that the photocatalyst particles and pigment were in an adsorption-/desorption equilibrium. During exposure to visible light, centrifuged and then screened via a Millipore filter, a suspension of about 5 mL was made at regular intervals. UV–vis spectroscopy was used to examine the filtrates.
Computational Details
To investigate the properties of pristine and N-modified TiO2 electronic structure, we performed spin-polarized plane-wave DFT calculations utilizing CASTEP [33]. The exchange and correlation energy was defined using the generalized gradient approximation (GGA) with the Perdew-Wang (PW91) [34] functional. An energy cutoff of 400 eV was employed within the calculations. To achieve accurate band gap values, the DFT+U approach with a U= 4 eV value was used to the 3d orbitals of Ti to correct the on-site Coulomb interactions [35]. The doped system anatase supercell, with a repetition number of 1 ˟ 2 ˟ 2. The N-doped configurations were made by replacing one O atom with one nitrogen atom. Because of the large size of the model employed, it was found that a Γ point sampling of the Brillouin zone was sufficient to get reliable geometries and electronic structure of TiO2 [36,37]. Throughout the geometry optimization, the tolerances for energy, maximum force, and maximum displacement were set to 10-5 eV/atom, 0.05 eV/atom, and 0.002 eV/atom, respectively. The atomic charges were obtained from the Hirshfeld analysis [38].
Results and Discussion
Photocatalyst Characterization
Patterns in the range of 2 diffraction angles between 20° and 80° were prepared to determine the nanoparticles' crystallite size and phase structure. Figure 2's XRD pattern primarily consists of anatase with a small rutile phase (80:20), indicating that the N dopant in TiO2 did not affect TiO2 particles' crystal patterns [39]. There are peaks for the major anatase phase at 2θ = 25.2(101), 38(004), 48.2(200), 55, and 62.5° in the photocatalyst. Additionally, there are peaks for a smaller percentage of the rutile phase at 2θ = 27.5(110) and 54°. Conferring to the Debye-Scherrer equation, the typical crystalline size is around 18 nm.
 Figure 2. XRD patterns of N/TiO2
Figure 3 depicts the prepared N/TiO2 nanoparticles' SEM images. The particles in this picture have a spherical shape, a dense structure with high uniformity, and are somewhat agglomerated. The amount of N-doped TiO2 in the sample did not affect the sample's morphology, as seen by SEM micrographs.
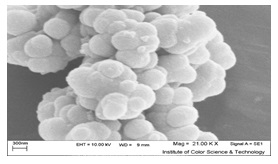 Figure 3. SEM images of prepared nitrogen-doped TiO2 nanoparticles.
Figure 4 depicts the optical absorption of pure and N-modified TiO2 nanoparticles. Because of the transition of electrons between the band structure and the defect level of TiO2, the absorption wavelength of N-doped TiO2 is significantly redshifted compared with the absorption wavelength of TiO2 nanoparticles. All samples' band gap energies are shown in Table 1. The results show that doping N into TiO2 reduces the optical band gap energy. DFT calculations were performed on pure and N/TiO2 to confirm the experimental findings. The relaxed structures of these nanoparticles are shown in Figure 5. The estimated λmax and Eg values of TiO2 and N/TiO2 nanoparticles are associated with the experimental values in Table 1.
For both nanostructures, DFT and experimental values coincide quite well. Compared to pure TiO2, the presence of an N atom in N/TiO2 tends to generate a bigger positive charge on the nearby Ti atom, according to the Hirshfeld charge density analysis. Furthermore, DFT calculations show that N-doping reduces the TiO2 band gap, probably because the band gap's center is closer to the valence band. This conclusion is also supported by prior DFT calculations on N/TiO2 [40], implying that N-doping improves the chemical reactivity of TiO2 by narrowing its band gap.
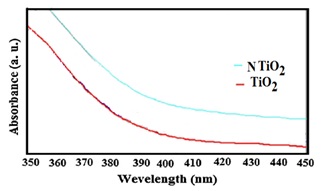 Figure 4. The Ultraviolet-Visible Diffuse Reflectance Spectroscopy (UV-Vis DRS) spectra of TiO2 and N/TiO2 nanoparticles.
 Figure 5. DFT optimized structure of pristine (a) and N-doped TiO2 (b)
Table 1. Experimental λ max and Eg values of TiO2 and N/TiO2 nanoparticles. The values within the parentheses refer to those obtained by the DFT calculations.

The photoluminescence (PL) spectra of pure and N-doped TiO2 nanoparticles stimulated by 320 nm are shown in Figure 6. The low peak intensity shows that the nitrogen doping of the TiO2 surface efficiently prevents the recombination of photogenerated electrons and holes, leading to increased catalyst activity [41].
Photocatalytic Activity
At a wavelength of 597 nm, the photodegradation of N/TiO2 effectively removes blue 5 as a function of time in Figure 7. 100 mL dye solution was used in the batch test. Afterward, the dye solution was stirred by adding 0.08 to 0.2 mg/L of catalyst to the dye solution with a 20ppm dye concentration. As a result, the optimal N-TiO2 catalyst was 0.16 mg/L, but due to the slight alteration between 0.14 and 0.16 of the catalytic amount and economic considerations, the optimal N-TiO2 catalyst was determined as 0.14 mg/L. As an outcome, the advancement of photocatalytic degradation was measured using a UV-Vis spectrophotometer set at λmax= 597 nm to measure the absorbance of solution samples. Using the equation below, the percentage of deterioration was computed by using the following equation:
![]()
The starting dye concentration is C0, while the dye concentration following treatments is C. Figure 7 shows that with 0.18 mg/L of catalyst, nitrogen-doped TiO2 has a high effectiveness of 99.5 percent in decolorization of crystal Blue5 in 75 minutes.
 Figure 6. The comparison of experimental photoluminescence spectra of pure TiO2 and N/TiO2
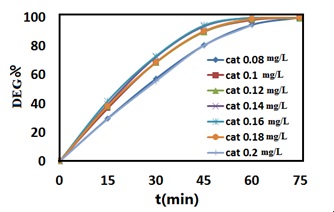 Figure 7. The comparison of the relationship between the percentage of dye degradation and different concentrations of N/TiO2 catalyst in times between 15 and 75 min.
Conclusion
Nitrogen-doped TiO2 powder prepared by sol-gel method. N-TiO2 photocatalytic activity was found to be substantially greater. Adding nitrogen to TiO2 prevented the change of phase from anatase to rutile, according to the XRD shapes. Compared to bare TiO2 nanoparticles, DRS results revealed a significant reduction of Eg value for N/TiO2 nanoparticles. The results showed that doping N into TiO2 reduced the optical energy of the band gap. However, the fall in Eg value for N/TiO2 was more significant than for pure TiO2.
Furthermore, DFT calculations suggested that N-doping decreases the value of the TiO2 band gap, owing to the center of the band gap moving nearer the valence band. For both pure and N/TiO2 nanostructures, there is a good agreement between DFT and experimental band gap values. This is mainly due to the nitrogen’s-excellent dispersion through the TiO2 surface. The best dye degradation results were observed through a catalyst concentration of 0.18 mg/L and a dye concentration of 20 ppm.
Acknowledgment
Maragheh University's molecular simulation laboratory provided hardware and software support for this project.
Disclosure statement
The authors reported no potential conflict of interest.
Orcid
Farzad Arjomandi Rad : 0000-0002-4864-5831
Jila Talat Mehrabad : 0000-0002-5866-8973
Mehdi D Esrafili : 0000-0002-9866-1880
|
HOW TO CITE THIS ARTICLE Farzad Arjomandi Rad*, Jila Talat Mehrabad, Mehdi D Esrafili. A Communal Experimental and DFT Study on Structural and Photocatalytic Properties of Nitrogen-Doped TiO2. Adv. J. Chem. A, 2023, 6(3), 244-252. DOI: 10.22034/AJCA.2023.391772.1358 |
)