Document Type : Original Research Article
Authors
College of Science, Chemistry Department, University of Baghdad, Baghdad, Republic of Iraq
Abstract
This study utilized the NAG-4SX3-3D analyzer (four sources of white snow light-emitting diodes arranged in three rows corresponding to three detectors), a tool for optical, chemical, electronic, and detection based on receiving cumulative signals (no amplification is required). Total travelling distance is 760 mm with regard to YZ(mV)–t sec (d mm). It was selected for its precise calculation of the energy transducer profile (NAG4X3) to accurately calculate the energy output detector. There was a goal to help scholars understand the technology better by giving them accurate information about the device. The technology provides a low-cost, efficient, precise, and responsive method. CPH in pharmaceutical samples has been determined using the turbidity technique. This procedure does not require the use of any extra materials. CPH is predicted to react immediately with 3,5-DNSA, resulting in the creation of a bright yellow precipitate. Cyproheptadine has a linear range of 0.005 to 40 mM. The relative standard deviation (RSD%) for the n = 6 at 10 mM and 15 mM doses was substantially less than 0.15%. Starting from the lowest concentration on the calibration curve and gradually diluting it, the limit of detection (LOD) was found to be 163.958 ng per analyte, and the limit of quantification (LOQ) was found to be 245.632 μg/sample. The linear dynamic range has a strong correlation value (r = 0.9986) and a high percentage of linearity (R2% = 99.72), with recovery not less than 95.78%. The findings of the newly created approach were found to be similar to those of the previous technique (UV-spectrophotometric at a wavelength of 274 nm). The suggested method demonstrates enhanced sensitivity, utilizes a reduced quantity of chemicals, and yields superior outcomes compared to the reference approach, which involves 10 mm irradiation.
Graphical Abstract
)
Keywords
Main Subjects
Introduction
Cyproheptadine hydrochloride has antihistamine and anti-serotonergic effects. Cyproheptadine hydrochloride is a solid that is crystallized and has a molecular weight of 350.9. It can be white or barely yellow. The chemical is soluble in water, methanol, and chloroform, but it's not very soluble in ethanol. In addition, it does not dissolve well in ether. The chemical formula for the dry salt is C21H12N•HCl. Children with stomach headaches may see short-term improvements. Cyproheptadine often causes side effects like increased hunger, weight gain, depression, and sleepiness. After two weeks of cyproheptadine treatment, there are noticeable changes to the structure of the cells. These changes are called ultrastructural alterations. Long-term use of cyproheptadine makes these impacts worse by affecting the insulin-producing cell. [1-4]. Multiple approaches have been used for estimating the concentration of cyproheptadine-HCl in both its pure form and in samples for medicine, such as: GC[1-3], HPLC [4-8], FAAS [9], HP-LPME-FAAS [10], spectrophotometry [5,11], FIA [12-16], turbidimetry [17-19], chemiluminescence [20]. This study employed the continuous flow injection analysis method to generate a bale yellow precipitate. The production of a precipitate as a consequence of the reaction of Cyproheptadine-HCl with 3,5-DNSA was seen and quantified. The precipitate was examined at 0-180˚ using a handmade NAG-4SX3-3D Analyzer (Nagham-four sources of white snow light-emitting diodes arranged in three rows corresponding to three detectors) a tool for Optical- Chemical-Electronic and Detection, based on receiving cumulative signal (no amplification is required). Total travelling distance is 760 mm with regard to YZ(mV) – t sec (d mm). It was selected for its precise calculation of the energy transducer profile21].
The present study provides the first report on the utilization of newly developed (Nagham-four sources of white snow LED arranged in three rows corresponding to three detectors (NAG-4SX3-3D Analyzer), which are based on flow analysis principles, for the optoelectronic determination of cyproheptadine hydrochloride in turbidimetric samples. Due to the importance of cobalt ion in our lives, this study attempts to estimate it, which provides an alternative technique to the traditional technique that was previously described.
Table 1. Essential chemicals and reagents utilized in this study
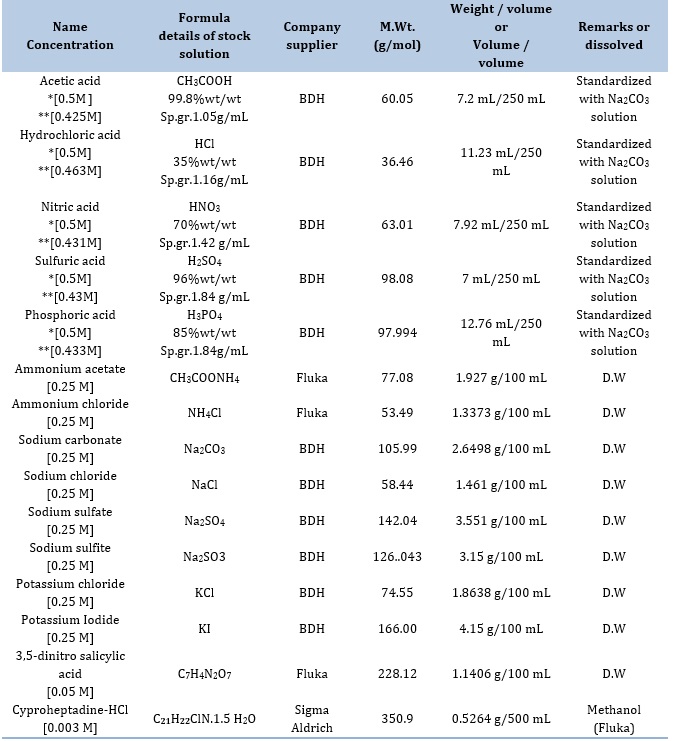
*The initial concentration of the chemical compound before being standardized using sodium carbonate solution.
**The chemical compound's final concentration after being standardized using sodium carbonate solution.
Hence, a cost-effective and compact optoelectronic detector was developed to enable comprehensive turbidimetric measurements in continuous flow injection analysis.
Experimental
Chemical preparation
The reagents and substances used in this investigation were of analytical grade, unless explicitly stated differently. Table 1 presents the main chemicals used as standard stock solutions in the present study. The original stock solution was diluted to provide supplementary standard solutions.
Apparatus
As displayed in Figure 1(A) the signal resulting from the reduction of light (0-180) is obtained using a flow-chamber made from an internally assembled NA.G-4S.X3-3D analyzer [21]. The signals were recorded using potentiometric recorders manufactured by Siemens, a well-known German corporation. A six-port peristaltic pump is attached to a Teflon sample loop that may be changed in length. We used the UV-Spectrophotometric instrument made by Shimadzu in Japan to perform the routine operations.
Methodology
Based on the results shown in Figure 1 (A), the procedure for calculating cyproheptadine hydrochloride (CPH) entails reacting 3,5-dinitro salicylic acid to produce a yellow precipitate. The manifold that is part of the NAG-4SX3-3D analyzer comprises two lines. The system consists of an introductory unit that is specifically designed for the purpose of sample categorization. To be more precise, it includes an injection valve that is equipped with both load and injection positions. This device ensures a high degree of dependability by making it much easier to repeatedly inject an exact amount. The experimental conditions included a sample size of 267 μL, with a concentration of 12 mM for CPH and 0.5 mM for 3,5-DNSA. The carry line stream (H2O) and the 3,5-DNSA agent line had respective flow rates set at 1.5 mL/min. The first line in the system offers a carry line that transfers the CPH sample zones; it is connected to a Y-junction point. When sedimentary species are produced and light incidence is reduced on white precipitate surfaces, the energy response of the transducer is evaluated using the x-y potentiometric record output. A white- snow LED (W.S.L.E.D.) that radiated three mixed-band wavelengths was used to expose the precipitated particles in the research to radiation.
This experiment aimed to determine the transducer's energy response in millivolts (mV) during a certain time period. In three replications, every solution was evaluated. Repetitive evaluations of the (NAG4X3) analyzer transducer output (Yzi in mV) for CPH concentrations of 12 mM are shown in Figure 1(B) in relation to tmin (in dmm). The CPH system, specifically designed for 3,5-DNSA, efficiently coordinates and shows all results in a concise and organized manner. The synchronization technique presented in this context introduces a novel approach within the NAG-4SX3-3D analyzer.
Results and discussion
Chemical parameters
3, 5-dinitro salicylic acid
Distilled water was used to dilute the 3,5-DNSA stock solution, resulting in a variety of solutions with concentrations between 0.35 and 1.5 mM. The apparatus used in the experiment was set up with a sample volume of 267 μL. By leaving the valve in the open position, the reagent and the carry route (distilled water) would both consistently flow at a rate of 1.5 mL/min. The measurement was conducted in triplicate. In this work, the energy transducer response variations brought about by variations in 3,5-DNSA concentrations are investigated using a (NAG4X3) analyzer. The results of the investigation showed that the height of the precipitate species was positively correlated with the concentration of 3,5-DNSA. As the concentration of 3,5-DNSA increased, there was a corresponding increase in the attenuation of incoming light. This increase continued until it reached a maximum at a concentration of 1.0 mM. The sensitivity of the signal-to-noise energy transducer is reduced with an increase in the concentration of 3,5-DNSA. The decrease in response observed could potentially be attributed to the dispersion of precipitation particles.
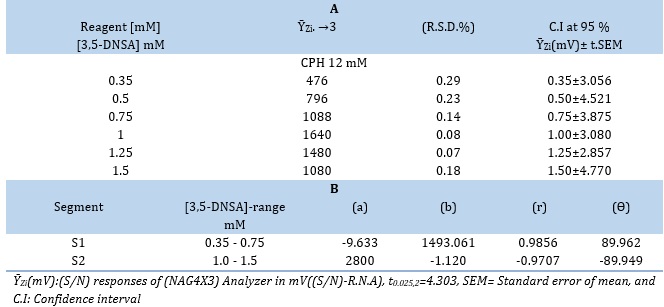
Therefore, it was determined that the ideal concentration of 3,5-DNSA for the CPH (12 mM-3,5-DNSA) system is 1.0 mM. Table 2(A) presents the results obtained from the system, whereas Table 2 (B) and Figure 2 depict the segmentation technique employed for selecting the most suitable segment. The optimal range for segment S2 is between 1.0 and 1.5 mM.
Impact of using various kinds of salts and acids
Various salts and acids were utilized as a transport line in this investigation. The study utilized a range of solution media, such as CH3COOH, HCl, HNO3, H2SO4, H3PO4, CH3COONH4, NH4Cl, NaCl, Na2SO4, Na2SO3, KI, and KCl, all at a concentration of 100 mM. In addition, distilled water was utilized as the aqueous medium.
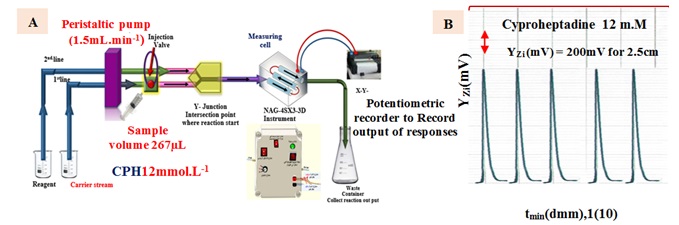
Figure 1. (A) A diagram illustrating the assessment of the NAG-4SX-3D Analyzer, and (B) Initial, replicated examines using the reaction of Cyproheptadine 12 mM with 3, 5-dinitrosalcylic acid to produce yellow precipitate, were performed to evaluate the (NAG4X3) instrument.
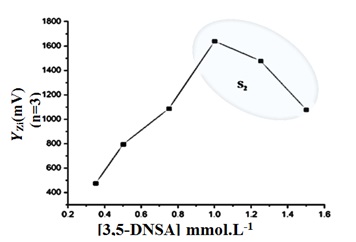
Figure 2. The output (as ῩZ i (mV))( Ῡ-Z i=3 ) transducer response.
Table 2. (A) Effect [of 3,5-DNSA] on precipitation of CPH and (B) Segmentation pattern: (Intercept(a)mV, Slope(b)mV/ mM , correlation coefficient (r), and angle (Ө) with selection of optimum segment
A deliberate decision was made to exclude acids and salts from the study of this system due to their propensity to precipitate. Precipitates may disrupt the flow and block the system's whole manifold section, which would cause responses to become distorted and ΔtB's base width to enlarge. This study examines that how various media affected the response's decline in the signal-to-noise (S/N) ratio. Increased agglomeration produces a greater degree of density and compactness among the aggregates, which is the phenomenon responsible for the drop in question. As a result, there are more vacant spaces within the particle agglomerates, which raises the incident light intensity. The fundamental reasoning was carefully considered before deciding not to use a certain carrier stream, as presented in Table 3.
Physical variables
Flow rate
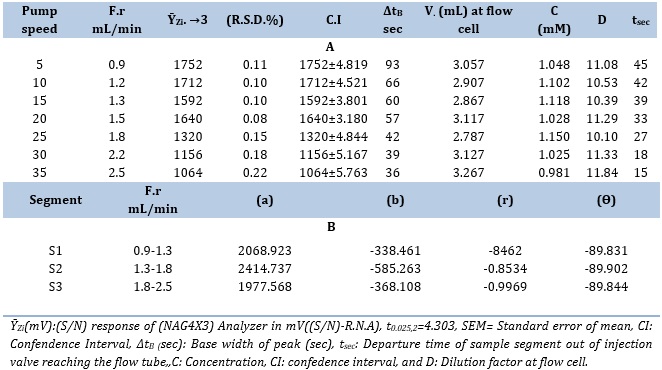
The CPH solution with a concentration of 12 mM and the 3,5-DNSA solution with a concentration of 1.0 mM were used in the experiment. The sample volumes were 267 μL, which were chosen based on their respective optimal concentrations. The system utilized a variable flow rate (F.r) ranging from 0.9 to 2.5 mL/min (Figure 3).
Figure 3. Effect of flow rate (F.r) on the response.profile
Table 4 presents the results that were achieved. It has been established that the CPH (12 mM)-3,5-DNSA system has a 1.5 mL/min flow rate for both the reagent and carrier streams. Dilution and dispersion are responsible for the observed broadening of the peak base (∆tB) at lower (F.r). In addition, it is important to observe that there is a discernible decrease in the peak height when the (F.r) surpas 1.5 mL/min. This observation suggests that there is an irregular response when the (F.r) exceeds 1.5 mL/min. This phenomenon can be attributed to the increased velocity of the precipitated particles, which allows them to efficiently traverse the measuring cells. The appropriate (F.r) of the carrier stream for the CPH12 mM 3,5-DNSA system has been determined utilizing the slope-intercept method within the chosen segment, S2 (1.3-1.8 mL/min), as summarized in Table 4(B).
Table 3. The impact of various media on the CPH12 mM- 3,5-DNSA 1.0 mM system produces a whitish precipitate
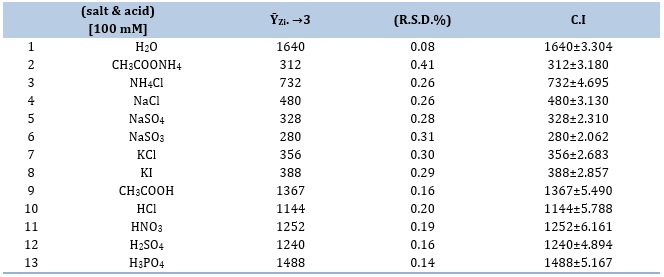
Table 4. (A) Effect of flow rate (F.r) variation on CPH 12 mM- 3,5-DNSA system and (B) Segmentation pattern with ideal choice
Sample volume
The investigation looked at how the system was affected by different sample volumes (S.V.) of 25, 40, 50, 60, 80, 120, 228, 267, and 326 μL. The system's carry line and reagent line were both run at the ideal flow rate (F.r.) of 1.5 mL/min. When the sample volume was increased, the response height increased as well, but the response profile remained unaffected until a volume of 267 μL was achieved. When the volume passed 267 μL, an extension of the peak maxima and an increase in the base width (ΔtB) were seen. Table 5 (A) presents the findings. Table 5 (B) presents the many uses of the slope-intercept approach in figuring out the best sample volume for the CPH-3,5-DNSA system.
Reactivity loop lengths' impact
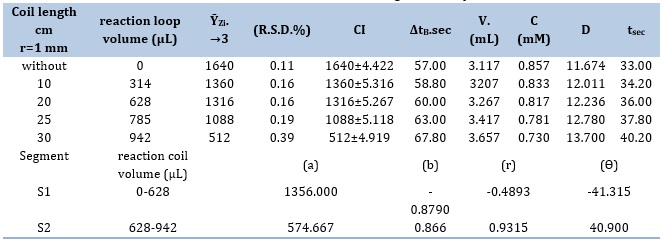
In this work, the volume of reaction coil range (0-942 μL) or coil lengths ranging from 0 to 30 cm were studied. An integral part of the flow system, the Y-junction is a crucial attachment. The optimal coil lengths for the CPH (10 mM) - 3,5-DNSA (1.0 mM) system were determined after an extensive investigation. The sample volume used for the analysis was 267μL, and the (F.r) used was 1.5 milliliters per minute. The profile of different response coil lengths and their effect on sensitivity are shown in Table 5. A signal-to-noise (S/N) energy transducer provides the data used for the evaluation. There is evidence of a link showing that the coil's sensitivity and length are inversely related. wider particles being produced, particulate weight rising, and particles dispersing across a wider surface area are the reasons for this occurrence. This thereby makes it more difficult for them to move about the flow cell effectively. Reaction coil use was avoided by both systems. The results are shown in Table 6, S1 (0-628) μL is the chosen segment, as demonstated by the slope-intercept calculation findings.
Impact of Y-junction
It is critical to use solution mixing to produce precipitated particle matter. Consequently, a variety of designs with mixing chambers of varying capacities have been used. Various diameters were developed in addition to junction areas in order to evaluate the effect of varied diameters on agglomeration as well as the regulation and uniform distribution of particles prior to their entrance into the flow tube. The study was carried out after the best parameters for the CPH (12 Mm)-3,5-DNSA (1.0 mM) system were identified. The investigation produced a broad base and a short peak height. A few of the answers show anomalies in both systems. This problem might be caused by the large capacity of the mixing chamber, which could lead to uneven mixing of the complimentary reactant or incomplete reactions. As a result, different sizes and shapes are produced, which in turn results in turbulent flow when the material is transferred to the measurement cell.
Furthermore, the precipitated particulate's dispersibility is influenced by the physical processes, namely dilution and dispersion, which also affect its distribution on the moving segment within the measurement cell. The analysis comes to the conclusion that when the tube intersects with a 2 mm inner diameter and a 4 mm outlet, yielding a volume of 12.56 μl, this is the best result for mixing reactants to generate precipitated particles.
Estimating the linear-range for CPH using a scatter plot
The preceding sections delineated the ideal settings for the physical and chemical variables of CPH, which included a sample volume of 267 μL, no delay reaction coil, and a flow rate of 1.5 mL/min for both the agent line stream and the carry stream.
Table 5. (A) The effect of sample volume (S.V) on the growth of a yellow precipitate
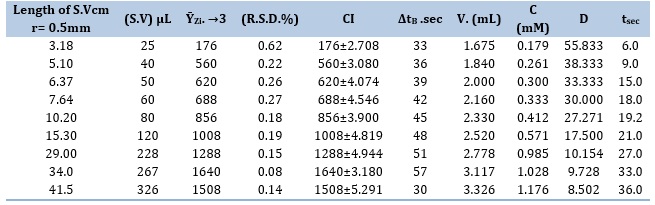
Table 5. (B) Segmentation pattern with ideal choice

Table 6. Effect of the reaction coil with segmentation pattern
The CPH-3,5-DNSA system has a variety of solutions containing Cyproheptadine-HCl at concentrations ranging from 0.005 to 40 mM. Three measurements have been made for each. The energy response of the transducer (E.R.T.) was measured and plotted against the Cyproheptadine-Hydrochloride concentration. The CPH-3,5-DNSA system is shown as a linear curve in Figure 4 with a concentration range of 0.005-40 mM. Above a concentration of 40 mM, the system's correlation coefficients show a declining trend and depart from linearity. The most likely explanation for this phenomena is the increase in particle count that occurred before the detector, which may have been caused by attenuation of the radiation. Furthermore, up to values of 40 mM, the results show a strong association between the variables. However, when the concentrations rise, the calibration graph's linear and direct connection gradually deviates from reality. It is possible that this phenomena is connected to an increase in precipitated particulate matter and its capacity to produce a relatively inflexible lack of inter-particulate space, which in turn hinders the passage of leftover light to the detector.
A newly created approach was evaluated and assessed for determining the CPH-3,5-DNSA(1.0 mM) system by comparing it to an established reference method, namely the spectrophotometric method (Figure 5 (A and B)) [22,23]. The spectrophotometric method is based on the measurement of absorbance at a specific wavelength (λmax= 274 nm) over a range of concentrations, as outlined in Table 7. In addition, the recorded and organized results of the turbidity method can be found in Table 7.
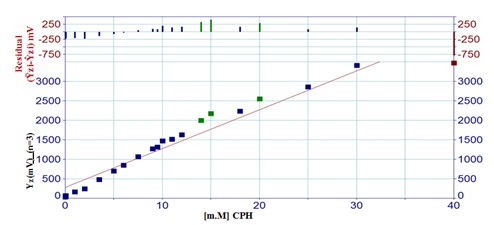
Figure 4. A variable range for the impact of CPH concentration on the attenuation of incident light when utilizing the (NAG4X3).
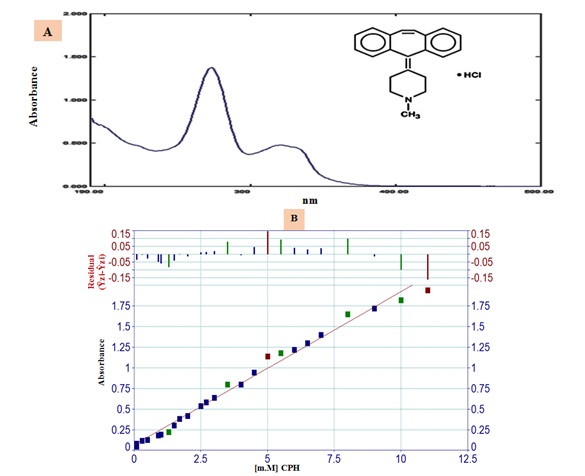
Figure 5. (A) The UV-absorbance spectrum at a concentration of 7 mM and (B)The scatter plot using the conventional technique at λmax = 274 nm.
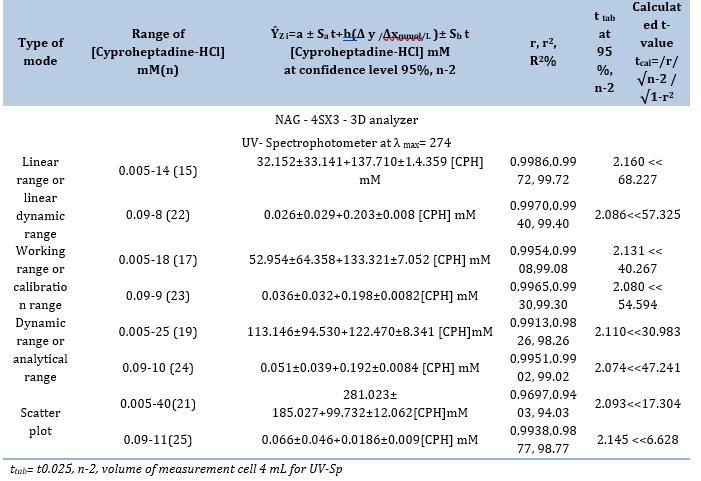
Table 7. The findings of a linear regression analysis by a first degree equation of the form =a+b x
Detection of limit (LOD)
Table 8 illustrates three different methods that have been utilized to ascertain the cyproheptadine-HCl limit of detection [24] for the CPH-3,5-DNSA)1.0 mM) system.
Repeatability
The assay procedure's precision was assessed by employing two distinct concentrations of the CPH3,5-DNSA system, as presented in Table 9. Every evaluation was conducted in a consecutive manner, with an average of six repetitions. Based on the data analysis, it can be observed that the concentration exhibited a percentage relative standard deviation of less than 0.135%.
Determination of Cyproheptadine-HCl in drugs using a homemade (NAG4X3) analyzer
The objective of this study is to analyze the concentration of Cyproheptadine-HCl in pharmaceutical drugs using a custom-made (NAG4X3) analyzer. CPH samples from three reliable pharmaceutical manufacturers were analyzed using the (NAG4X3) analyzer: CYPRODAD (4 mg, Pioneer), PERIACTIN (4 mg, ALGORTHM), and PRACTIN (4 mg, Wockhardt Limited). Utilizing the established approach, the maximum absorbance at 274 nm was measured and compared with the conventional spectrophotometric method. The conventional addition approach was used to evaluate the CPH-3,5-DNSA (1.0 mM) system.
Table 8. LOD of cyproheptadine-HCl at optimum parameters
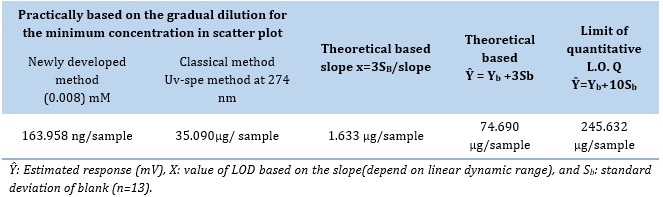
Table 9. Repeatability of cyproheptadine-HCl at optimum parameters
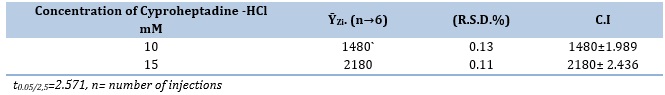
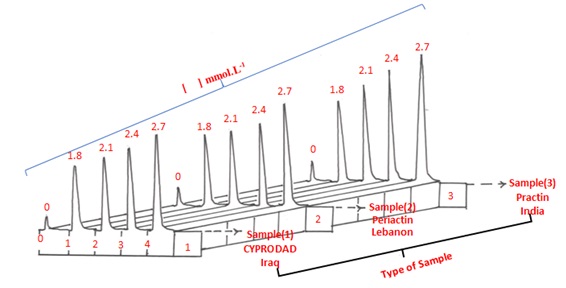
Figure 6. Profile of responses vs time for standard addition method.
The active component was diluted 1 mM-1.0141 g into 100 mL of each prescription medication to create the solutions. Then, five milliliters of each solution were cautiously added to separate 10-milliliter volumetric flasks. The CPH-3,5-DNSA (1.0 mM) system was subjected to incremental quantities of a 30 mM standard solution of Cyproheptadine-HCl as shown in Table 10 A. The study's response profile is shown in Figure 6. Table 10. A provides a brief summary of the results obtained using the conventional adds approach for three different pharmaceutical drug samples. The detected CPH values are shown in the Table10. A. The data that summarizes the results from three distinct techniques is shown in Table 10. A. Data on the active ingredient's practical content, calculated with a 95% confidence level, are shown in the table. It also contains details on the t-test for comparing two distinct pathways and the efficiency of determination.
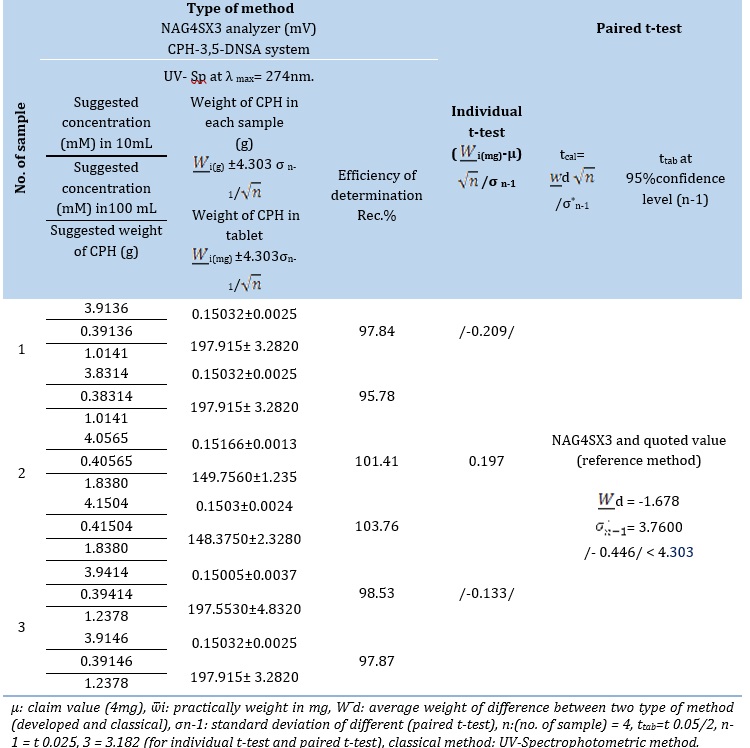
Individual t-test [25]
By calculating the tcal for each company, as a comparison is conducted between a newly discovered approach and the officially cited figure of 0.4 mg as shown in Table 10.B. Three different firms' practical content means (W ̅i) do not show a substantial deviation from the stated figure (μ0 = 4 mg). The findings show that, for the medications under investigation, the observed t-value (ttab) is greater than the estimated t-value (tcal) at a 95% confidence level. This implies that there is no statistically significant distinction between the quoted value and the calculated ttest.
A paired t-test [26]
Research was done to contrast traditional spectroscopic methods with the recently developed analytical approach of the NAG4X3 analyzer. Three distinct samples from three different firms were used to perform the comparison. Considering that different manufacturers do not take individual characteristics into account.
Table 10. (A) Standard addition using the two methods
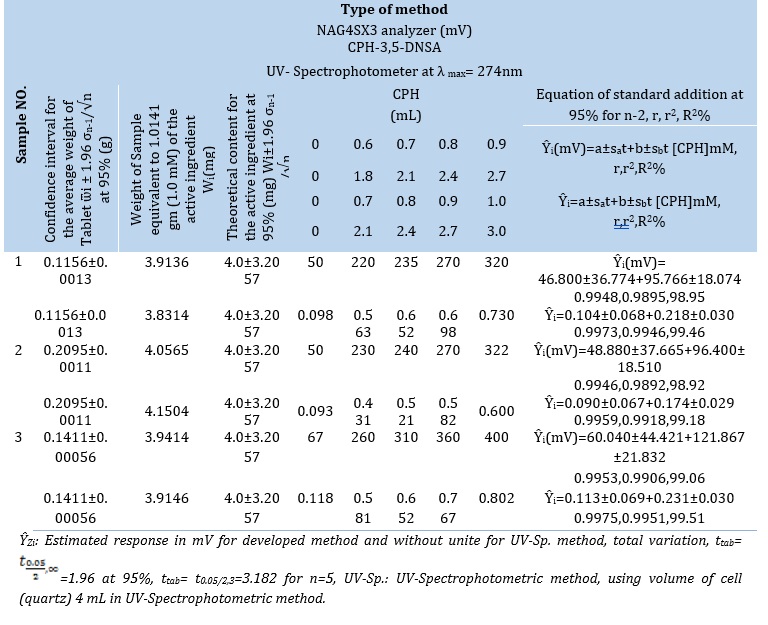
Table 10. (B) The results obtained using the standard addition method for determining the content efficiency of CPH in three drug samples are as follows: the percentage recovery (% Rec) values. In addition, a t-test was conducted to compare the three methods used
Conclusion
This study integrates CFIA with NAG-4SX3-3D to propose an enhanced and novel approach for assessing CPH in pharmaceuticals. Based on the results, it can be concluded that the process is repeatable, has low limits for both detection and quantification, uses a small number of reagents. All things considered, this innovative method of sample preparation has great potential for use in environmental and pharmaceutical research, especially when dealing with complex matrices like biological materials. This strategy offers a rapid, straightforward, and economical way. Three separate pharmaceutical samples underwent analysis to identify the potential presence of cyproheptadine-HCl. The proposed method, NAG-4S3X-3D analyzer, was utilized for this objective, and the findings were compared to those acquired using UV-spectrophotometry.
Acknowledgements
The authors would like to thank Prof. Issam M.A. Shakir for his invaluable counsel, insightful observations, and encouragement.
Orcid
Nagham Shakir Turkey : 0009-0002-7925-6633
Bakr Sadiq Mohammed : 0009-0002-1784-1837
Issam Mohammad Shakir : 0009-0002-1810-3406
HOW TO CITE THIS ARTICLE
Nagham Shakir Turkey, Bakr Sadiq Mohammed*, Issam Mohammad Shakir. Determination of Cyproheptadine-Hydrochloride by Precipitation with 3, 5-Dintrosalicylic Acid via the NAG-4SX3-3D Analyzer at 0-180˚. Adv. J. Chem. A, 2024, 7(3), 303-318.
DOI: 10.48309/ajca.2023.428749.1460
)